


Auto Trader Group Plc (AUTO) specialises in the digital automotive marketplace. The company provides products and services to retailers and home traders to support their online activities. It offers vehicle advertisement on its Websites for individuals; and display advertising on its Websites for advertising agencies and retailers, as well as insurance and loan financing products to consumers. The company has a headcount of 804 employees, including full-time and on a contract basis.
Financial Highlights for FY2019 (£, million)
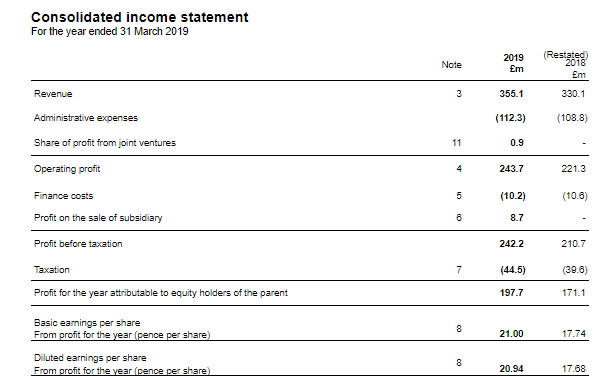
(Source: Annual Report, Companyâs website)
The revenue was up by 8 per cent to £355.1 million in FY2019 against £330.1 million in the previous year. Operating profit was up by 10 per cent to £243.7 million in FY2019 against £221.3 million in the last year. The Operating profit margin surged to 69 per cent this year against 67% in FY2018.Â
Profit before tax was up by 15 per cent to £242.2 million this year against £210.7 million in FY2018; which includes a profit of £8.7 million received on the consolidation of Smart Buying, a strategic partnership between the Cox Automotive and the company. Â
Basic EPS was up by 18 per cent to 21.00p per share this year as compared to 17.74p in FY2018. Diluted EPS surged by 18 per cent to 20.94 pence per share this year as compared to 17.68 pence per share in FY2018.
Cash flow from operations went up by 13 per cent to £258.5 million this year against £228.4 million in FY2018. This happened due to the steady Operating profit along with the low working capital requirements.  Customer receivables and collections strongly drove cash conversion. About £151.1 million was paid back to the shareholders through £93.5 million of share buybacks along with dividends of £57.6 million in FY2019.
The Gross external bank debt went down this year to £313.0 million against £343.0 million in FY2018. The company also proposed a final dividend of 4.6 pence per share this year against 4 pence per share in FY2018. The annual dividend would be 6.7 pence per share this year as compared to 5.9 pence per share in FY2018.
The Cash and cash equivalents were up by 37.20 per cent to £5.9 million this year against £4.3 million in FY2018. The Borrowings went down by 8.94 per cent to £310.3 million this year against £340.8 million in FY2018.
Auto Trader Group PLC Share Price Performance
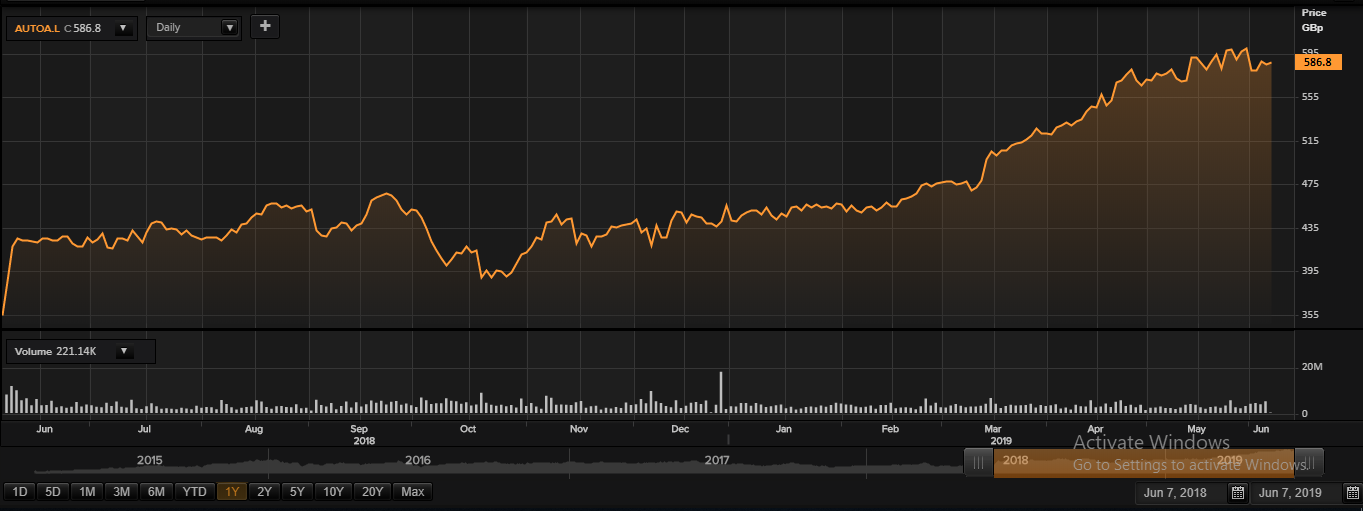
Daily Chart as at June-07-19, before the market close (Source: Thomson Reuters)
On June 7, 2019, at the time of writing (before the market closed, at 09:11 AM GMT), Auto Trader Group PLC shares were trading at GBX 586.8, up by 0.30 per cent against the previous day closing price. Stock's 52 weeks High and Low is GBX 601.40 /GBX 361.20. At the time of writing, the share was trading 2.42 per cent lower than the 52w High and 62.45 per cent higher than the 52w low. Stock's average traded volume for 5 days was 4,009,213.60; 30 days â 3,057,839.90 and 90 days â 3,174,859.54. The average traded volume for 5 days was up by 31.11 per cent as compared to the 30 days average traded volume. The companyâs stock beta was 0.32, reflecting lower volatility as compared to the benchmark index. The outstanding market capitalisation was around £5.43 billion, with a dividend yield of 1.15 per cent.
