


_06_19_2026_12_34_15_139937.jpg)

Highlights of the US-EU Trade Conflict
It was June 2018, when Donald Trump, on the grounds of national security situations, enforced Metal-Import tariffs on goods imported from the European Union. As a retaliation to this, Brussels imposed similar tariffs on a day to day goods used by the people, such as Levi Strauss jeans and bourbon whiskey followed by similar tariffs on luxury motorcycle maker Harley-Davidsonâs motorcycles.
European Union stated that USâ imposition of tariffs of around 25 per cent on steel as well as 10 per cent on aluminium is pure protectionism covered up in a security policy layer. This led to a sudden rise in trade tensions between the two states who were already fighting trade war on two separate fronts, with the United States in confrontation with the Chinese authorities, while the European Union was still in negotiations with the United Kingdom following the referendum of the UK leaving the European Union in 2016. The situation was even more complex in Britain, as if and when the formal exit of the UK complete, they will have to identify and work with new trade partners, and the United States could be the most important one, in case the negotiations with the European Union could not materialise.
Immediately after these sanctions from the European Union were imposed, Donald Trump widened the conflict by announcing 20 per cent tariffs as well as other barriers on all the European Cars coming into the United States of America. This statement sparked immediate tensions in the countries all over the world, as any further escalation would have meant a large economic fallout for a number of countries involved, which no nation could have afforded, especially in a period of economic stagnation going on at that time.
US Import of Automobiles and Parts â In Numbers
The member nations of the European Union, exported vehicles worth â¬192 billion in the year 2016, as reported in research by some media source in 2018. Out of this â¬192 billion, the highest number of vehicles (approximately 25 per cent) were exported to the United States during the year, amounting to â¬48 billion or £42 billion. While, in the same year, the European Union member nations imported a total of â¬10 billion worth of vehicles from the United States of America.
In a research conducted by the Centre for Automotive Research (CAR), it was reported that out of all the export of vehicles from the US, around 52 per cent were made in the United States, while the rest of 48 per cent were imported from the rest of the world. It was reported that if tariffs are applied as the President of the United States had mentioned in his statement; it would lead to an average price rise of around US $4400 in the vehicles sold in the United States. It was also reported that prices of USâassembled vehicles would increase because of a surge in the cost of vehicle parts from other countries, adding another around US $2,270 to the price. Normally for an imported vehicle, these additional taxes increase the prices by US $6,875 for every vehicle sold. An additional price rise in imported vehicles will lead to increase in production for the US manufactured vehicles, which would consequently lead to 2 million additional units of US production of vehicles, while the sales of imported vehicles could fall by around 4 million, which could cause significant implications for the UK based automotive and component companies.
What does the heating trade conflict mean?
On 22nd January 2020, after the longest period in which car tariffs were not acted upon by the US Administration, a new conflict revived regarding the talk of these tariffs. The Treasury Secretary of the US Administration, Mr Steve Mnuchin warned that the state would impose new tariffs on UK Automakers and auto parts companies, following the news that chancellor, Sajid Javid, was against the cancellation of a new tax structure on tech firms. This stance is expected to have a huge impact on some of the biggest companies from the United States of America such as Apple, Amazon and Facebook.
In the latest development, Mr Javid has said that trade negotiations with the European Union would take precedence over any new trade deal with the United States, which is exactly opposite to the view of the UK government appears right now, while also adding that any further discussions would take place between the heads of the two states, Mr Trump and Mr Boris Johnson, soon in the World Economic Forum to be held in Davos.
France already seems to have abided the US on this, as they have suspended any such new tax structure of the tech firms, after being threatened by the US with tariffs on French products, such as Wine, Cheese and Handbags, which are heavily imported.
Experts believe that at this current moment, it will be extremely courageous of the British Administration to enter into a trade war with the United States, because of the fact that as soon as the formal exit of the United Kingdom from the European Union is complete, it is likely that London will bank upon Washington to enter into new trade deals.
As soon as this news around tariffs on UK Automakers hit the stands, furious activity started at the auto stocks on the London Stock Exchange. Here are the key stocks that could see action with further developments on this.
AML Share Price Performance
As on 23rd January 2020, (11:30 A.M GMT), at the time of writing this report, Aston Martin Lagonda Global Holding Plcâs stock value has been reported to be at GBX 427.00 per stock on the LSE market, a decline in the value of 1.64 per cent or GBX 7.10 per stock, in comparison with the trading price of the stock on the previous day, that has been reported to be at GBX 434.10 per stock. The market capitalisation of Aston Martin Lagonda Global Holding Plc was reported to be at £989.76 million with regards, to the price at which the companyâs share was trading at the time of writing.
The stock was trading 15.06 per cent, above its 52-week low price of GBX 371.10 per share, which it achieved on August 15, 2019. The 52-week high price of the companyâs stock was reported to be at 1374.40 per share, which it achieved on February 27, 2019.
SCE Share Price Performance
As on 23rd January 2020, (11:35 A.M GMT), at the time of writing this report, Surface Transforms Plcâs stock value has been reported to be at GBX 26.00 per stock on the LSE market, a decline in the value of 2.98 per cent or GBX 0.80 per stock, in comparison with the last trading price of the stock on the previous day, that has been reported to be at GBX 26.80 per stock. The market capitalisation of Surface Transforms Plc was reported to be at £36.47 million with regards, to the price at which the companyâs share was trading at the time of writing.
The beta of the stock of the company has been reported at a value of 1.29, which basically means that the Surface Transforms Plcâs stock has shown more volatility in its movement, as opposed to the volatility of the comparative index in the last twelve months.
TRT Share Price Performance
As on 23rd January 2020, (11:45 A.M GMT), at the time of writing this report, Transense Technologies Plcâs stock value has been reported to be at GBX 69.00 per stock on the LSE market, a surge in the value of 2.13 per cent or GBX 1.50 per stock, in comparison with the last trading price of the stock on the previous day, that has been reported to be at GBX 70.50 per stock. The market capitalisation of Transense Technologies Plc was reported to be at £11.50 million with regards, to the price at which the companyâs share was trading at the time of writing.
The beta of the stock of the company has been reported at a value of 1.85, which basically means that the Transense Technologies Plcâs stock has shown more volatility in its movement, as opposed to the volatility of the comparative index in the last twelve months.
Comparative share price chart of AML, SCE and TRT
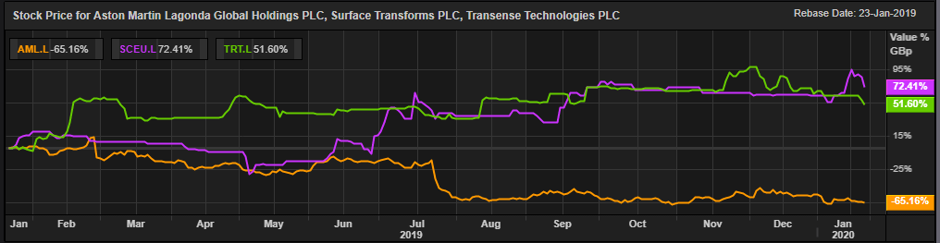
(Source: Thomson Reuters) Daily Chart as on 23-January-20, before the closing of the LSE Market
