


Spectris PLC
Spectris PLC (SXS) is a supplier of productivity-enhancing controls and instruments. The operations of the group are differentiated in four operating divisions: Test and Measurement, Industrial Controls, Materials Analysis, and In-line Instrumentation. The Test and Measurement business supplies software and services for product design optimization, micro seismic monitoring, test measurement and analysis equipment, environmental noise monitoring, and manufacturing control.
The Industrial Controls division of the company offers solutions and products that control, measure, monitor and connecting production processes. Materials Analysis division of the company is into providing services and products for limit structure, quality and quantity of materials etc.
Analytical measurements of processes, online controls and asset monitoring is provided by In-line Instrumentation segment. It is also associated with converting industries providing consumables and services for key processing.
Financial Highlights (H1 FY2019, £ million)
(Source: Interim Reports, Company Website)
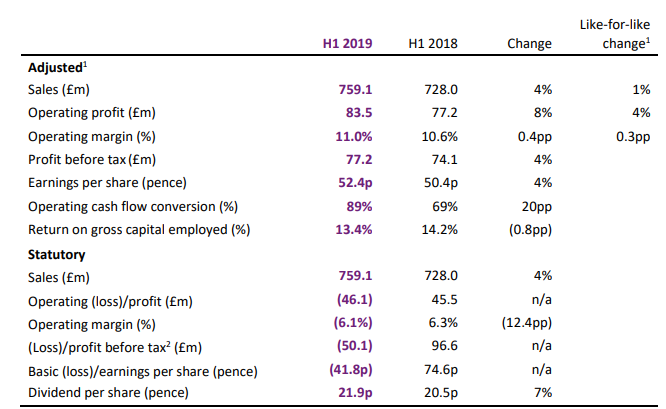
In H1 FY19, the companyâs adjusted sales increased by 4 per cent as compared with the corresponding period of the last year, due to the increase in like-for-like sales of 1 per cent, growth from acquisition, net of disposals, which contributed £7.1 million, and favourable foreign exchange movements of £15.7 million. Adjusted operating profit rose by 8 per cent to £83.5 million against the £77.2 million in H1 FY18, while like-for-like operating profit increased by 4 per cent. On a statutory basis, operating loss stood at £46.1 million. Adjusted operating margins were 11 per cent, an increase of 0.4% against 10.6% in H1 FY18. LFL gross margin declined to 55.2 per cent in H1 2019, impacted by adverse product mix, input cost inflation, and higher production overheads.
Adjusted profit before tax surged 4 per cent to £77.2 million as compared to £74.1 million in H1 FY18, while statutory loss before tax stood at £50.1 million. Adjusted earnings per share were 52.4 pence, an increase of 4 per cent from corresponding prior-year period. On a statutory basis, loss per share stood at 41.8 pence. The company had a strong operating cash flow conversion of 89 per cent, an increase of 20% compared to 69 per cent in H1 FY18. Return on gross capital employed reduced by 0.8% to 13.4 per cent as compared to 14.2 per cent in H1 FY18. The companyâs board declared an interim dividend per share of 21.9 pence, an increase of 7 per cent compared to the corresponding period of the last year. The company is focusing on implementing a strategy for profitable growth in future.
Outlook
In the first half of 2019, the company delivered an in-line result, despite the challenging macroeconomic environment. In H1 FY19, while there was moderation in LFL sales, profitability, and cash conversion increased. For the full year 2019, the companyâs prospects remain decent, though the current macroeconomic conditions make it a bit more challenging. In the second half of 2019, the company expects to continue benefitting from the profit improvement programme. The company has completed its strategic review and is clear on the prospects and potential ahead. The company is now focused on creating significant value for the employees, customers, and shareholders and executing the strategy for profitable growth. In the financial year 2019, benefits from profit enhancement programme is now projected at the upper end of the £15-20 million range with the expected exit run rate of £30 million.
Share Price Performance
Daily Chart as on 07-August-19, before the market close (Source: Thomson Reuters)
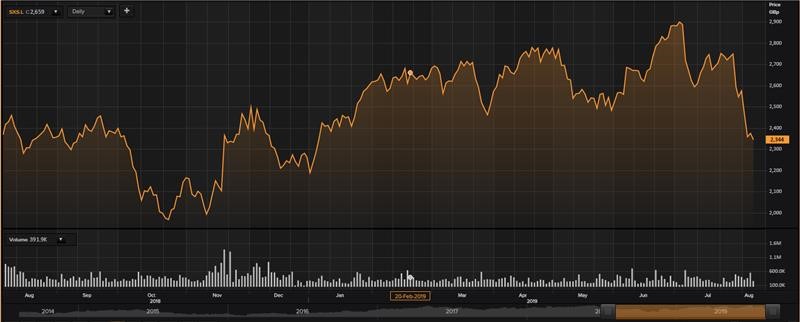
On 7th August 2019, at the time of writing (before the market close, at 3:41 pm GMT), Spectris PLC shares were trading at GBX 2,344, down by 1.306 per cent against the previous dayâs closing price. The stock's 52 week High and Low prices are GBX 2,932/GBX 1,924.50. The stockâs average traded volume for 5 days was 388,879.80; 30 days â 292,521.17 and 90 days â 280,586.92. The average traded volume for 5 days was up by 32.94 per cent compared to 30 days average traded volume. The companyâs stock beta as on date was 0.91, reflecting less volatility as compared to the benchmark index. The outstanding market capitalisation of the company was around £2.75 billion, with a dividend yield of 2.63 per cent.
Ferrexpo PLC
Ferrexpo Plc (FXPO) is a Swiss iron ore mining company. It is involved into the production, processing and export of iron ore pellets. The companyâs assets are situated in the Poltava region of Ukraine. The company serves customers in Europe and Asia including Slovakia, Austria, China, South Korea, Germany, Czech Republic, Taiwan, Turkey, Vietnam and Japan. Ferrexpo also carries out ore processing and logistics operations. The company is in the business of processing, mining and selling top notch iron ore pellets to the worldwide steel industry for more than 40 years.
Financial Highlights (H1 FY2019, US$ million)
 (Source: Interim Report, Company Website)
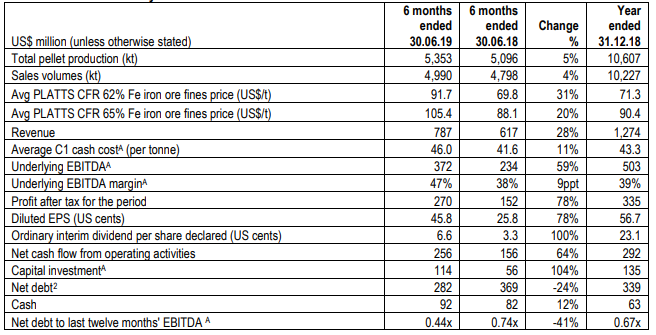
In H1 FY2019, the companyâs sales volume increased by 4 per cent to 4,990 kt as compared with the corresponding period of the last year. The groupâs reported revenue increased by 28 per cent to US$787 million as compared to US$617 million in H1 FY18, reflecting a surge in sales volumes and higher iron ore fines prices. The underlying EBITDA rose by 59 per cent to US$372 million against the prior-year period, due to increase in sales volumes. The groupâs underlying EBITDA margin stood at 47 per cent. Profit after tax for the period increased by 78 per cent to US$270 million against US$152 million in 2017, driven by lower interest expense and higher profit before tax. Basic earnings per share (EPS) increased to 45.9 US cents as compared to 25.9 US cents in H1 FY18. The interim dividend per ordinary share rose by 100 per cent to 6.6 US cents, due to increased capital investment and continued debt reduction. Net debt stood at US$282 million, a decline of 24 per cent as compared to US$369 million in H1 FY18. In H1 FY2019, the companyâs capital investment rose by 104 per cent to US$114 million. In H1 FY19, the cash balance increased by 12 per cent to US$92 million as compared with the corresponding period of the last year. Net debt to LTM EBITDA stood at 0.44x, a decrease of 41 per cent as compared to 0.74x in H1 FY18. Net cash flow from operating activities stood at US$256 million, an increase of US$100 million from the corresponding prior-year period. Working capital reflected a US$70 million of net outflow. This was mainly driven by the surge in trade receivables and pellet stocks given the high-price environment.
Outlook
The company is the 3rd largest exporter of pellets and has maintained top-notch quality and at a lower cost. The company sells its product to world-class customers which include big corporates from the steel industry. The company is able to maintain adequate capital allocation between a strong balance sheet, investments required for growth and returns to shareholders. The company has well established internal control systems which helps it to mitigate the risks associated with the operations of the company. The company might face macro headwinds with respect to higher input prices of commodities, local inflation in the Ukrainian economy and Brexit â related uncertainties.
Disruption to the companyâs operations could be due to a deterioration of the geopolitical situation in Ukraine; strengthening of UAH vs the USD; weaker-than-expected pellet premiums; and higher-than-expected mining cost inflation in Ukraine. In H1 FY19, the company continued gaining from robust pricing for the higher quality of iron ore pellets, which augmented cash inflows. In some regions, steel demand is muted and reflecting weaker end-user demand and higher raw material costs. The companyâs pricing power remains protected against the historical levels. The company had shown improvement in its top and bottom-line performances in the current half-year and will be able to increase its production in the upcoming financial year. On 8th October 2019, the company is expected to announce Q3 FY19 production results.
Share Price Performance
Daily Chart as an 07-August-19, before the market close (Source: Thomson Reuters)
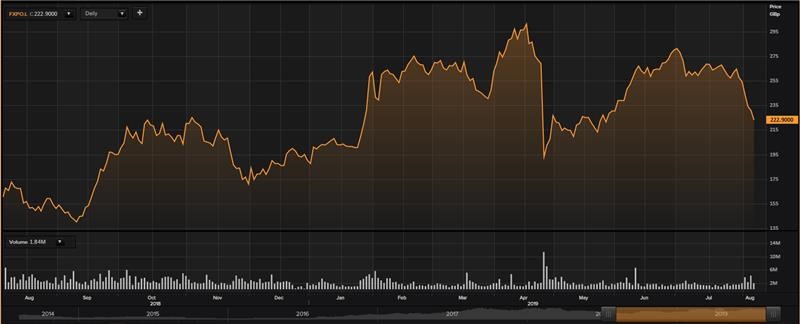
On 7th August 2019, at the time of writing (before the market close, at 3:55 pm GMT), Ferrexpo PLC shares were trading at GBX 222.90, down by 3.42 per cent against the previous dayâs closing price. Stock's 52week High and Low is GBX 305.60/GBX 134.34. Stockâs average traded volume for 5 days was 2,632,354; 30 days â 1,558,652.67 and 90 days â 1,910,871. The average traded volume for 5 days was up by 68.89 per cent as compared to 30 days average traded volume. Ferrexpo PLCâs stock beta as on date is 1.78, reflecting higher volatility as compared to the benchmark index. The outstanding market capitalisation stood at around £1.36 billion, with a dividend yield of 4.71 per cent.
