


BHP Group Plc
BHP Group Plc (BHP) is one of the world's renowned resource company. The company is engaged in the operations of extraction and processing of minerals, gas and oil. The company is having an employee base of more than 60,000, including contractors, mainly in the Americas and Australia. Norges Bank Investment Management, The Vanguard Group, Inc., BlackRock Investment Management (UK) Ltd. and Legal & General Investment Management Ltd. are the major institutional investors in the group. (Source: Thomson Reuters).
BHP-Recent News
The company is into mining operations and is heavily reliant on fossil fuels. As a global paradigm shift, the company is moving towards renewable sources of energy. The company has signed contracts with renewable energy suppliers to fuel its copper mining sites in Chile. The company possesses the control of Spence and Escondida (copper mines) for which it had entered into 15-year and 10-year contracts with Enel Generacion and Colbun respectively. The company believes its good for the environment, emissions and reducing the carbon footprint. These signed contracts shall commence after 2021.
BHP-Financial highlights for FY19
In FY2019, the group's revenue recorded a growth of 2.6 per cent on YoY basis to $44,288 million, as a result of an increase in the sale of copper. Underlying EBITDA from continuing operations during the period remained flat at $23.2 billion against the year-ago period. Underlying profit attributable to shareholders stood at $9,124 million, up by 2 per cent from the last year. EBITDA margin shrank marginally against the previous financial year to 53 per cent. Return on capital during the year, expanded by 170 basis points to 16.1 per cent from 14.4 per cent recorded in the year-ago period. Underlying basic EPS surged by 5 per cent to 176.1 cents per share. The group's net debt during the year declined substantially by 16 per cent to $9.21 billion from $10.93 billion recorded at the end of FY18, and this reflects a strong free cash flow of the group. Dividend per share for the FY19 jumped by 13 per cent to 133 cents per share.
The Return on Equity (ROE) of the company was around 16.8 per cent for the fiscal year 2019, which was greater than the mean of Return on Equity for the industry (11.4 per cent). The companyâs performance over the last half-decade has resulted in 10 per cent higher volumes and unit cost reduction of 20 per cent or more across the companyâs major assets. The companyâs major improvements in the operational performance were offset by unplanned outages, weather impacts and resource headwinds during the period under consideration.
BHP-Share price performance
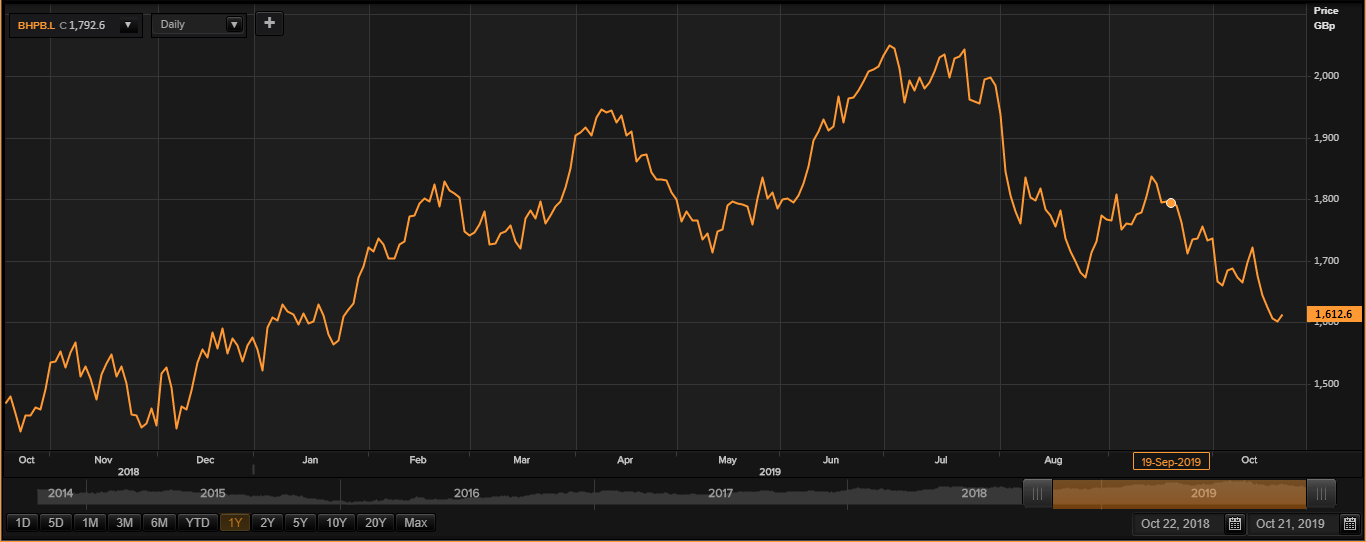
At the time of writing (21/10/19 before the market close, at 01:00 PM GMT), shares of the BHP were trading at GBX 1,612.6 and surged by 0.78 per cent against the previous closing price.
Volume Summary
The 5-day average daily shares that exchanged hands stood at 4,735,213.20, which was around 11.40 per cent below the 30-day average daily volume (5,344,960.17) that exchanged hands at the London Stock Exchange. The dayâs volume in the stock stood at 1,547,447 with 6,826 trades taking place at the London Stock Exchange (before the market close).
52wk H/L range
In the past 52-wks, shares of the BHP have registered a high price of GBX 2,078.50 and a low price of GBX 1,391.99, and at the current trading level, as quoted in the price chart, shares were quoting around 15.84 per cent above the 52w low price level.
Price Performance (%)
On a YoY basis, shares of the BHP have delivered a positive price return of 8.30 per cent and the benchmark index by approximately 6.43 per cent up over the same period. However, on a year-to-date basis, the stock has recorded a positive price return of approximately 1.61 per cent and was down by around 10.89 per cent in the past one month.
Simple Moving Average (SMA)
From the Simple Moving Average standpoint, shares were quoting below the 200-day simple moving average price and quoting below its 60-day and 30-day SMA prices as well.
Relative Strength Index (RSI)
The 30-day and 14-day relative strength index were strengthening at 37.48 and 31.93, respectively.
Royal Dutch Shell Plc
Royal Dutch Shell Plc (RDSA) is a Hague, Netherlands-based international group of energy and petrochemical company, which engages in exploring, producing, refining and marketing oil and natural gas.
RDSA-Recent News
As per some media sources, the company is looking forward to selling its onshore upstream assets in the Western Desert (Egypt). The company is planning to bolster and expand its offshore gas exploration in Egypt.
As on September 30, 2019, the group reported third-quarter update. During the third quarter of 2019, the group's Integrated gas production is expected to be between 930 and 960 thousand barrels of oil equivalent per day, and LNG liquefaction volumes are expected to be between 9.0 and 9.30 mt. Upstream Production is expected to be between 2,600 and 2,650 thousand barrels of oil equivalent, and Refinery availability would be in between 90% to 92%, respectively.
RDSA-Financial highlights for H1 FY19
During the first half under consideration, the groupâs revenue stood at $174,278 million, which was 6.4 per cent lower against $186,000 million recorded in H1 FY18, led by a dip in the revenue from all reportable segments during the period. The total revenue and the other income stood at $177,499 million in H1 FY19 versus $190,382 million in H1 FY18. The companyâs total expenditure had declined to $163,176 million in H1 FY19 from $172,405 million in H1 FY18. The PBT (Profit before tax) declined by 20.33 per cent from $17,977 million in H1 FY18 to $14,323 million in H1 FY19. The companyâs profit for the year attributable to the shareholders stood at $8,999 million in H1 FY19 as against $11,923 million in H1 FY18. The basic earnings per share for H1 FY19 was $1.11 versus $1.44 in H1 FY18. The diluted earnings per share for H1 FY19 was $1.10 versus $1.42 in H1 FY18.
The company has increased its competitive portfolio for the period with the introduction of first LNG cargo from Prelude and Appomattox and expect to generate added cash in future. The companyâs customer-facing and Upstream businesses are flexible and will contribute to generating cash flows to meet FY2020âs outlook.
RDSA-Share price performance
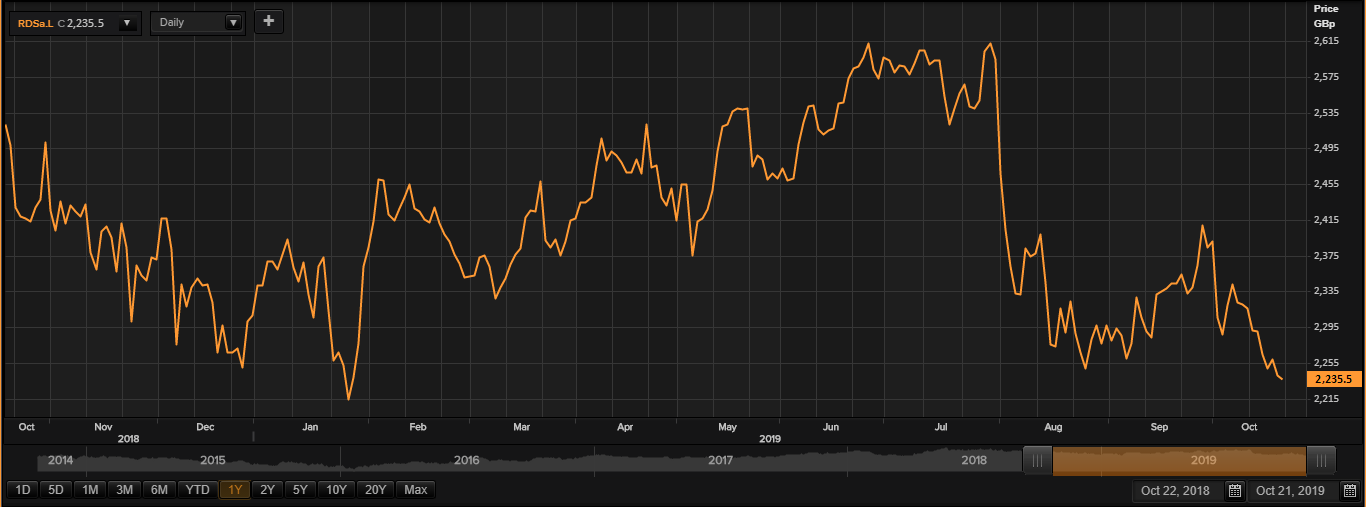
At the time of writing (21/10/19 before the market close, at 01:06 PM GMT), shares of the RDSA were trading at GBX 2,235.5 and leapt lower by 0.20 per cent against the previous closing price.
Volume Summary
The 5-day average daily shares that exchanged hands stood at 6,495,159.00, which was around 2.56 per cent above the 30-day average daily volume (6,332,464.60) that exchanged hands at the London Stock Exchange. The dayâs volume in the stock stood at 1,358,883 with 4,058 trades taking place at the London Stock Exchange (before the market close).
52wk H/L range
In the past 52-wks, shares of the RDSA have registered a high price of GBX 2,811.38 and a low price of GBX 2,209.50, and at the current trading level, as quoted in the price chart, shares were quoting around 1.17 per cent above the 52w low price level.
Price Performance (%)
On a YoY basis, shares of the RDSA have delivered a negative price return of 9.97 per cent and the benchmark index by approximately 11.52 per cent down over the same period. However, on a year-to-date basis, the stock has recorded a negative price return of approximately 2.93 per cent and was down by around 4.17 per cent in the past one month.
Simple Moving Average (SMA)
From the Simple Moving Average standpoint, shares were quoting below the 200-day simple moving average price and quoting below its 60-day and 30-day SMA prices as well.
Relative Strength Index (RSI)
The 30-day and 14-day relative strength index were strengthening at 41.13 and 36.40, respectively.
