


Mondi Plc
Mondi PLC (MNDI) is a global leader in packaging and paper and is fully integrated across the packaging and paper value chain, with key operations spread in central Europe, Russia, North America and South Africa. The companyâs operations are differentiated in three operating segments, namely Fibre Packaging, Consumer Packaging and Uncoated Fine Paper.
MNDI-Recent news
The company hosted an investor site visit to Steti, Czech Republic on 06th November 2019. The guests visited the companyâs best in class, Steti pulp and paper mill integrated with cost efficiencies and with a production capacity of approximately 700ktpa. The company enjoys best in the industry margins and returns on backdrop of competitive advantages. The company will continue to invest in relationships, digitalisation and product innovation to derive growth and sustainability in years to come.
MNDI-Q3 Trading Update
On 10th October 2019, Mondi announced its trading update for the 3rd Quarter from 1st July 2019 to 30th September 2019. The demand in the Q3 remained on the softer side. Underlying EBITDA for Q3 FY2019 was down by 18 per cent to â¬383 million versus Q3 FY2018 data and was down by 9 per cent versus Q2 FY2019 data. Due to lower uncoated fine paper and industrial bags volumes, the companyâs sales on Like-for-like basis remained marginally lower than Q3 FY2018 data. Planned mill maintenance impacted underlying EBITDA by â¬40 million for the period. The company is making good progress in capital investment projects in central Europe.
MNDI-Financial Highlights â H1 Financial Year 2019 (30th June 2019, ⬠million)
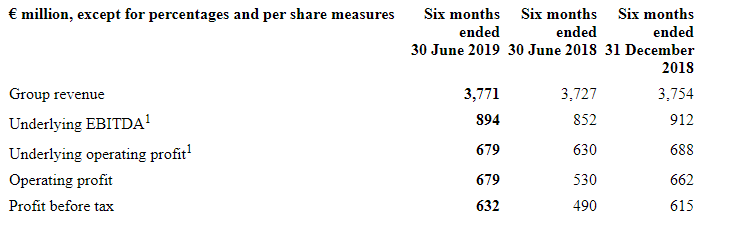
(Source: LSE)
For the first half for the financial year 2019, the companyâs revenue increased to â¬3,771 million from â¬3,727 million in H1 FY2018. The increase in the revenue was driven by an increase in revenue from Fibre Packaging business and Consumer Packaging business for the period. The companyâs underlying EBITDA stood at â¬894 million for H1 FY2019 against â¬852 million in H1 FY2018. The companyâs underlying EBITDA margin stood at 23.7 per cent for H1 FY2019 against 22.9 per cent in H1 FY2018. The companyâs underlying operating profit (EBIT) surged to â¬679 million from â¬630 million in H1 FY2018. The companyâs reported operating profit (EBIT) surged to â¬679 million from â¬530 million in H1 FY2018. The companyâs PBT (Profit before tax) surged to â¬632 million in H1 FY2019 from â¬490 million in the first half of the financial year 2018. The companyâs underlying basic earnings per share were 96.2 cents in H1 FY2019 versus 89.2 cents in H1 FY2018. The companyâs basic earnings per share were 95.8 cents in H1 FY2019 versus 72.5 cents in H1 FY2018. The companyâs net debt stood at â¬2,358 million as of June 30th, 2019. The companyâs cash flow from operations was up by â¬15 million to â¬737 million in H1 FY2019.
MNDI-Share price performance
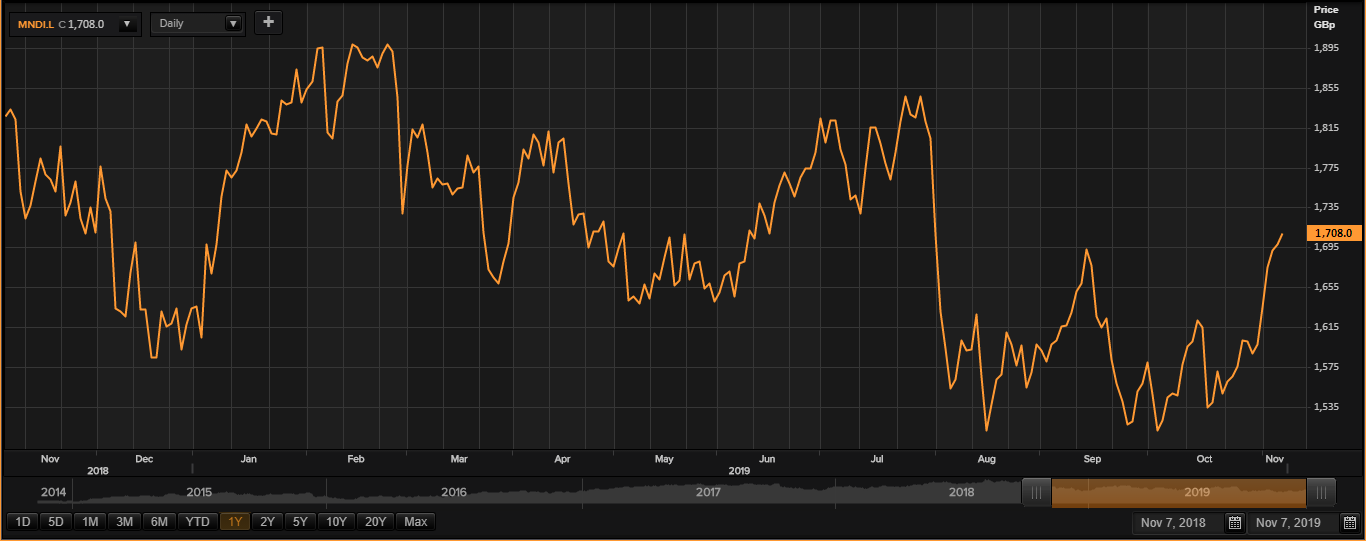
(Source: Thomson Reuters)
While writing (as on 07th November 2019, at 11:39 AM GMT), Mondi Plc shares were trading at GBX 1,708.00 per share; surged by 0.64 per cent as compared to the previous day closing price level. The companyâs market capitalisation was around £8.26 billion.
MNDI shares have clocked a high of GBX 1,936.50 (as on 15 February 2019) and a low of GBX 1,484.00 (as on 25 September 2019) in the past year. At the current price point, as quoted in the price chart, the companyâs shares were trading 11.79 per cent below the 52-week high price point and 15.09 per cent above the 52-week low price point.
At the time of writing, the stockâs volume before the market close, stood at 568,079. Stock's average daily traded volume for 5 days was 1,414,710.00; 30 days- 1,940,565.57 and 90 days â 2,192,081.33. The companyâs stock beta (5Y monthly) was 1.47, which makes it more volatile as against the benchmark index.
The average daily traded volume for 5 days plunged by 27.10 per cent as against 30 days average daily traded volume. At the time of writing, the shares of the company were trading above the 30-days and 60-days SMA.
In the past 1 month, MNDI shares have delivered a positive return of 11.61 per cent. Also, on a YTD (Year-to-Date) time interval, the stock surged by approximately 3.89 per cent and was up by 9.24 per cent in the last three months.
Share's RSI (Relative Strength Index) for the 30-days, 14-days and 9-days was recorded at 57.59, 68.90 and 77.33 respectively. Also, the stockâs 3-days RSI was recorded at 95.74.
Gfinity Plc
AIM-listed Gfinity PLC (GFIN) is a leading global esports business group. Backed by gamers of the worldâs most enthusiast gamers and occasion viewers, the company has a distinctive understanding of this fast-expanding worldwide community. The group utilizes its expertise to outline, create and deliver exceptional experiences and to offer consultancy services and winning approach for sports right holders, media companies, game publishers, and commercial partners.
GFIN-Financial Highlights (for the year ended 30 June 2019, £million)
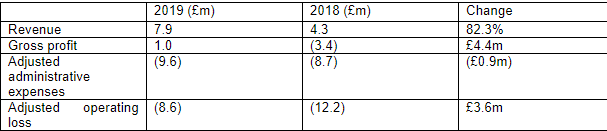
(Source: LSE)
In the financial year 2019, the companyâs reported revenue increased to £7.9 million as compared with the previous year, reflecting both the value of the investments in products, technology, and people in recent years and the strength of the strategic account relationships with a blue-chip customer base, who continue to look to the company for their esports solutions and also represented a year-on-year surge of over 80 per cent for a second consecutive year. Gross profit surged by £4.4 million to £1 million in FY19 against the loss of £3.4 million in FY18, due to strategic emphasis on delivery of higher-margin esports solutions for main partners. Adjusted operating loss reduced by £3.6 million to £8.6 million as compared to a loss of £12.2 million in FY18. On 30th June 2019, the net cash stood at £0.6 million, augmented by completion of £5.25 million capital raise in July 2019.
The company has refocused the business on a Strategic Client Management model that has enabled them to bolster the current strategic partnerships and build a strong pipeline of new commercial prospects.
GFIN-Share price performance
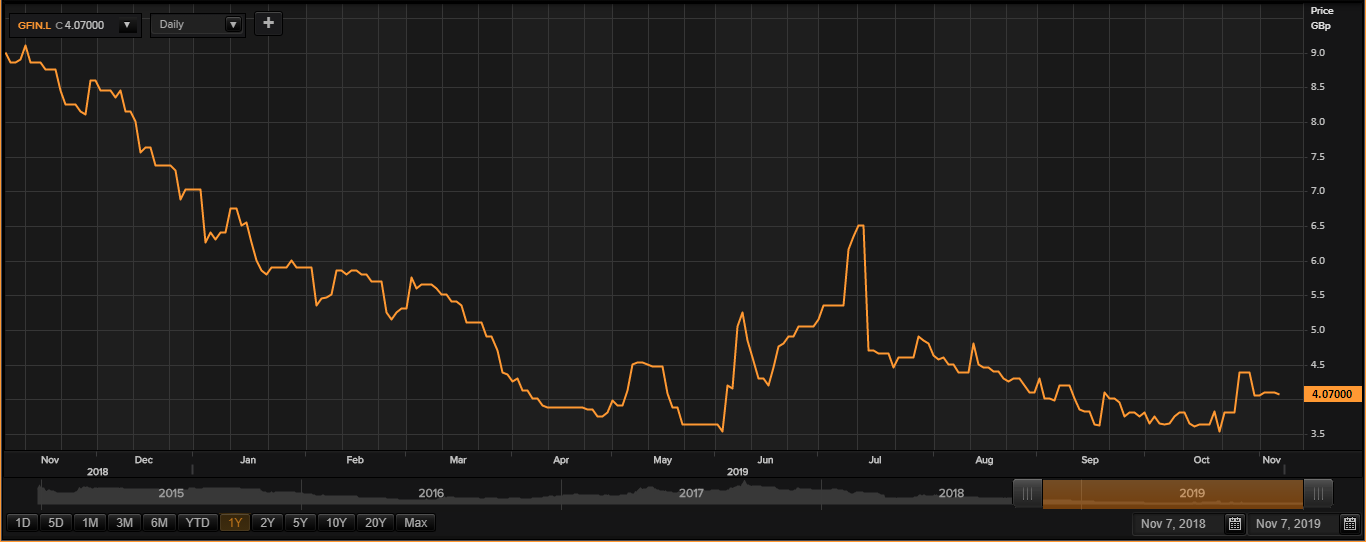
(Source: Thomson Reuters)
While writing (as on 07th November 2019, at 11:45 AM GMT), Gfinity PLC shares were trading at GBX 4.07 per share; plunged by 0.73 per cent as compared to the previous day closing price level. The companyâs market capitalisation was around £19.71 million.
GFIN shares have clocked a high of GBX 9.40 (as on 12 November 2018) and a low of GBX 3.25 (as on 04 June 2019) in the past year. At the current price point, as quoted in the price chart, the companyâs shares were trading 56.70 per cent below the 52-week high price point and 25.23 per cent above the 52-week low price point.
At the time of writing, the stockâs volume before the market close, stood at 118,812. Stock's average daily traded volume for 5 days was 577,556.80; 30 days- 1,275,668.17 and 90 days â 1,443,876.89. The companyâs stock beta (5Y monthly) was 1.85, which makes it more volatile as against the benchmark index.
The average daily traded volume for 5 days plunged by 54.73 per cent as against 30 days average daily traded volume. At the time of writing, the shares of the company were trading above the 30-days and 60-days SMA.
In the past 1 month, GFIN shares have delivered a positive return of 12.33 per cent. Also, on a YTD (Year-to-Date) time interval, the stock plunged by approximately 41.60 per cent and was down by 8.89 per cent in the last three months.
Share's RSI (Relative Strength Index) for the 30-days, 14-days and 9-days was recorded at 51.41, 55.80 and 57.18 respectively. Also, the stockâs 3-days RSI was recorded at 47.85.
Â
