


Reabold Resources PLC
United Kingdom-based investment holding company, Reabold Resources PLC (Identifier: RBD) is focused on investing in upstream oil & gas projects.
RBD-Financial highlights for H1 FY19
The company released interim results for the first half ended 30th June 2019. The companyâs loss was recorded at £1,699,000 for H1 FY19 as against loss of £746,000 in H1 FY18. The company managed to increase the production capacity of its assets in California, which led to revenues of £390,000 and gross profit of £172,000 in H1 FY19. The companyâs total administration costs stood at £368,000 in H1 FY19 as against £427,000 in H1 FY18, due to gains from foreign exchange and reduced legal charges. The companyâs net cash used in operating activities stood at £175,000 in H1 FY19. During the period, the company did not raise funds from placement of shares. The companyâs cash and cash equivalents were recorded at £2,765,000 as at 30th June 2019. The companyâs total net assets were recorded at £17,802,000 at 30th June 2019 as against £12,752,000 by the end of H1 FY18. The companyâs net current assets were recorded at £2,797,000 at 30th June 2019 as against £9,659,000 at the end of H1 FY18. The company still believes in the strategy to invest in less risky, high impact, upstream oil & gas projects.
RBD-Share price performance
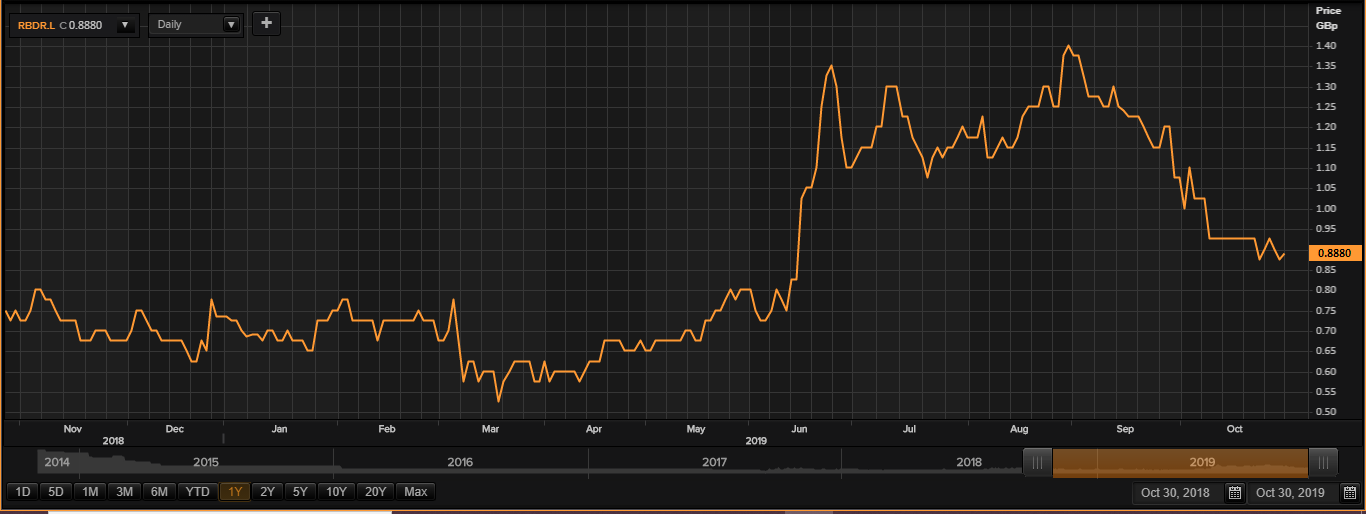
(Source: Thomson Reuters)
On 30th October 2019, while writing at 01:18 PM GMT, Reabold Resources PLC shares were clocking a current market price of GBX 0.88 per share, up by 0.57 per cent in comparison to the last traded price of the previous day. The companyâs market capitalisation was at £35.56 million at the time of writing.
On 29th August 2019, the shares of RBD have touched a new peak of GBX 1.75 and reached the lowest price level of GBX 0.51 on 16th January 2019 in the last 52 weeks. The companyâs shares were trading at 49.71 per cent lower from the 52-week high price mark and 72.54 per cent higher the 52-week low price mark at the current trading level as can be seen in the price chart.
The stockâs traded volume was hovering around 16,811,520 at the time of writing before the market close. The stock's 5-day average daily traded volume of the company was 38,288,417.80; 30 daysâ average daily traded volume- 32,993,919.70 and 90 daysâ average daily traded volume â 27,990,297.58. The volatility of the companyâs stock is lower as compared with the index taken as the benchmark, as the beta (5Y monthly) of the companyâs stock was recorded at 0.61.
The shares of the company have delivered a negative return of 23.91 per cent in the last quarter. The companyâs stock surged by 19.05 per cent from start of the year to till date. The companyâs stock has given investors 16.67 per cent of positive return in the last year. Â
Thor Mining Plc
Thor Mining Plc (Identifier: THR) is a development and exploration company primarily focussed on the development of tungsten resource, copper project along with exploration interests in lithium. The companyâs main projects are in Northern Territory of Australia and in Southern Australia. The company owns a tungsten project and a lithium project in Nevada, USA and Arizona, USA, respectively.
THR-Financial highlights for FY19
For the financial year ending 30th June 2019, the company remained in the development phase and hence did not generate any revenues. The companyâs operating loss stood at £764 thousand in the Financial Year 2019 as against an operating loss of £1,271 thousand in the Financial Year 2018. The loss before and after-tax stood at £735 thousand in the financial year 2019 versus loss before and after-tax of £1,249 thousand in the financial Year 2018.
The basic loss per share for FY2019 was 0.10 pence versus a basic loss per share of 0.23 pence in FY2018. As on 30th June 2019, the companyâs cash reserves stood at £523 thousand as against £1,374 thousand as on 30th June 2018. The companyâs total assets for the FY2019 were £12,766 thousand versus £11,815 thousand in FY2018.
Since the company is in the development phase, it doesnât generate any revenues, and all the operations are financed through its cash reserves and grants. Profitability has have significantly improved as compared to the corresponding prior year period. The company operates in a challenging environment which requires continuous investment, sometimes at the cost of profitability, to stay ahead of competitors. The company has been able to enhance its dominance in all its core assets significantly.
THR-Share price performance
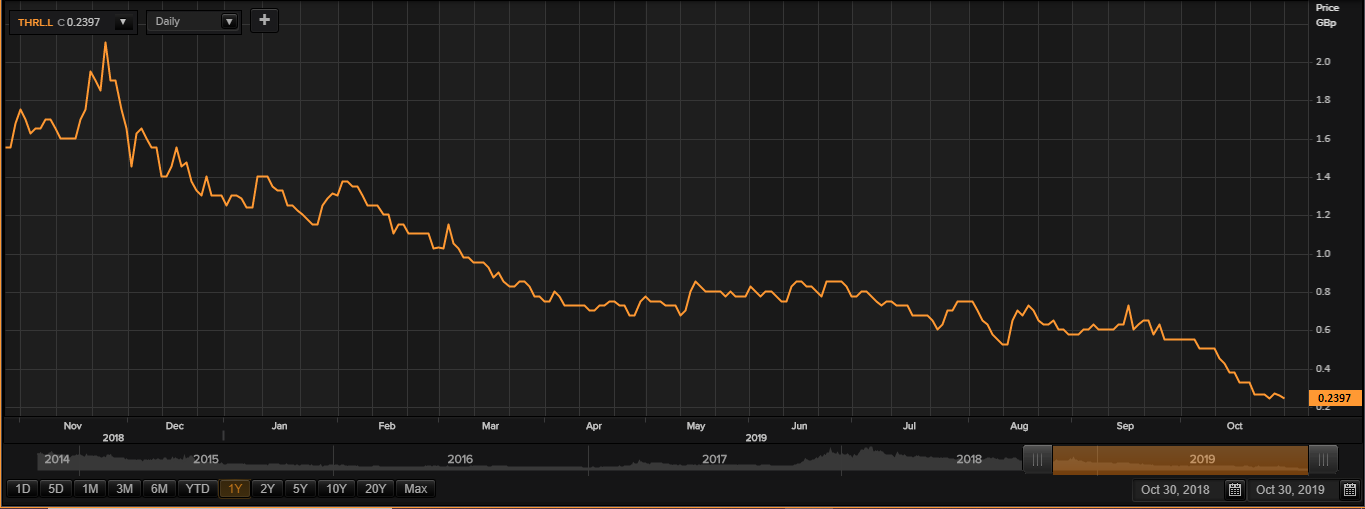
(Source: Thomson Reuters)
On 30th October 2019, while writing at 01:23 PM GMT, Thor Mining Plc shares were clocking a current market price of GBX 0.23 per share, lower by 8 per cent in comparison to the last traded price of the previous day. The companyâs market capitalisation was at £2.10 million at the time of writing.
On 26th November 2018, the shares of THR have touched a new peak of GBX 2.20 and reached the lowest price level of GBX 0.225 on 22nd October 2019 in the last 52 weeks. The companyâs shares were trading at 89.54 per cent lower from the 52-week high price mark and 2.22 per cent higher the 52-week low price mark at the current trading level as can be seen in the price chart.
The stockâs traded volume was hovering around 3,833,856 at the time of writing before the market close. The stock's 5-day average daily traded volume of the company was 7,615,159.40; 30 daysâ average daily traded volume- 6,959,806.83 and 90 daysâ average daily traded volume â 4,177,795.03. The volatility of the companyâs stock is lower as compared with the index taken as the benchmark, as the beta (5Y monthly) of the companyâs stock was recorded at 0.58.
The shares of the company have delivered a negative return of 63.57 per cent in the last quarter. The companyâs stock plunged by 80.38 per cent from start of the year to till date. The companyâs stock has given investors 83.55 per cent of negative return in the last year.Â
Â
