
.jpg)
_05_16_2023_17_11_27_393572.jpg)


Maestrano Group PLC (LON:MNO)
Maestrano Group PLC is a provider of cloud-based patented technology aimed at business intelligence, analytics and big data management, coupled with specialist hardware and software purposely created for capturing, analysing and finding insights on complex datasets by using sophisticated artificial intelligence algorithms within the transport sector.
MNO-Recent news
Australian Government Tender was awarded to Maestrano Group. Airsight, companyâs recently acquired subsidiary, has won a new contract with the Department of the Environment and Energy in Australia.
The Department of the Environment and Energy is supposed to protect certain regions from the effects of uranium mining in Northern Australia.  The mining operations in the region must cease by 2021 and revegetation of the region should be completed by 2026. The Department is looking forward to methods for revegetation of the site and is commissioning the drone-based technology to ensure that the revegetated site matches the surrounding environment.
The companyâs subsidiary, Airsight, shall deploy the site with drones having scanning capabilities. The drones would be equipped with sensors which can capture data metrics with reference to tree height, diameter, canopy depth and its diameter.
MNO - Financial highlights for FY19 period ended 30th June 2019
(Source: London Stock Exchange)
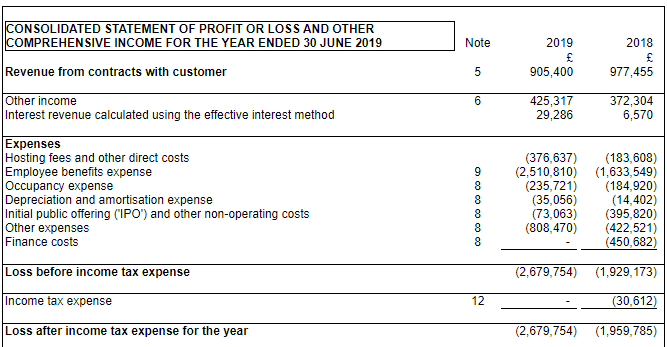
The companyâs revenue was recorded at £905,400 in the fiscal year 2019 as compared to £977,455 in the fiscal year 2018. The companyâs total comprehensive loss for the year stood at £2,691,422 as against £1,725,097 in the fiscal year 2018. The company had cash balances of £2,247,201 in the fiscal year 2019 as compared to £5,236,040 in the fiscal year 2018. The net assets of the company were valued at £2,490,209 in the fiscal year 2019 as compared to £5,181,631 in the fiscal year 2018. The basic loss per share stood at 3.35 pence in FY19 as compared to 8.11 pence in FY18.
The Company spent considerable effort and time assessing its strategy and generating various options from May 2019 onwards and into the subsequent financial period. Moreover, the company is looking to conserve cash, and accordingly investors should note that the companyâs performance for the fiscal year 2020 is largely dependent on events post period FY2019 and specifically, the acquisition of Airsight that was approved by shareholders in October 2019.
MNO-Stock price performance
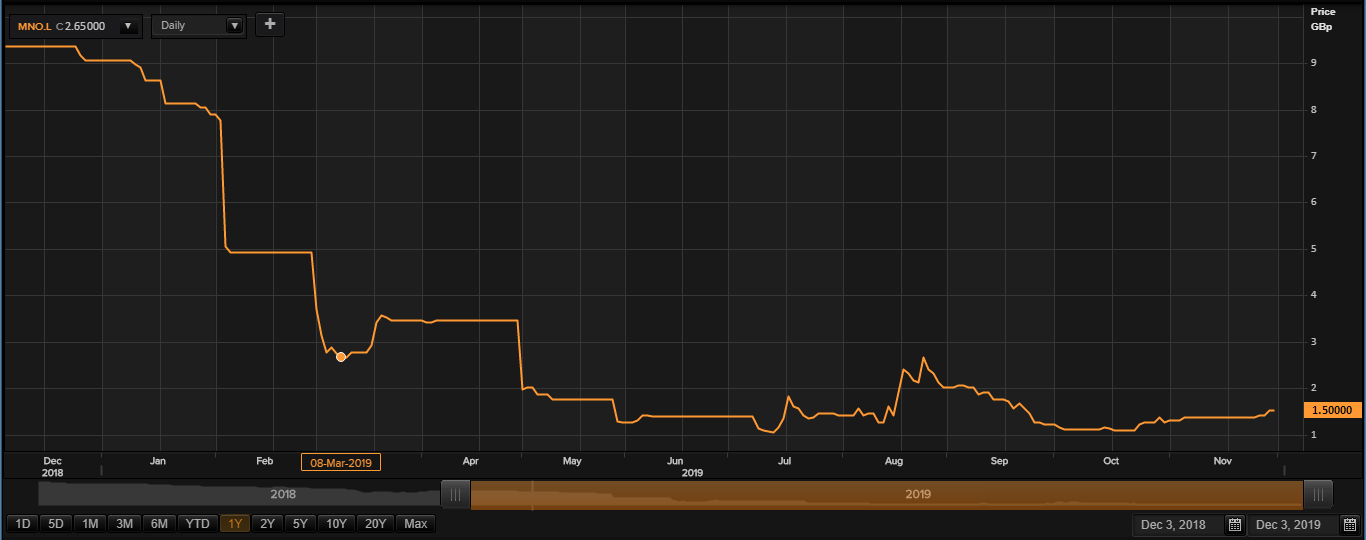
Daily Chart as at Dec-03-19, before the market close (Source: Thomson Reuters)
At the time of writing (before the market close, at 09:59 AM GMT), shares of the Maestrano Group PLC were trading at GBX 1.50 and remained flat as against the previous day closing price. The shares of the company got admission for trading on the Alternative Investment Market of the London Stock Exchange on 30th May 2018. The total M-cap (market capitalisation) of the company stood at £2.19 million.
Daily Traded Volume Summary
The 5-day average daily traded shares, which exchanged hands were recorded at 580,586.60, which was approximately 28.92 per cent less than the 30-day average daily traded shares, which exchanged hands at the LSE (London Stock Exchange).
52-week High/Low range
In the past 52 weeks, shares of the Maestrano Group have hovered between a high price level of GBX 9.38 (as on 5th December 2018) and a low-price level of GBX 0.94 (as on 11th July 2019). At the current level of trading, as quoted in the price chart, shares traded around 84 per cent below the 52-week high and were 59.57 percent above the 52-week low.
Price Performance (in percentage)
The shares of the Maestrano Group have delivered a negative price return of 83.96 per cent on a Year on Year (YoY) basis and performed similarly as the benchmark index delivered a negative price return of approximately 84.63 per cent over the same period. Moreover, the stock has given a negative price return of approximately 83.43 per cent on a year-to-date (YTD) time frame and was up by approximately 15.38 per cent in the last one month.
Relative Strength Index (RSI)
The RSI indicator for the shares of the company for the 3-days, 9-days and 14-days was recorded at 99.98, 92.31 and 78.20 respectively. Also, the stockâs 30-days RSI was recorded at 55.87.
KEFI Minerals PLC (LON:KEFI)
Mining company, KEFI Minerals Plc emphasises on maximising shareholders return and capital appreciation by exploration and development base metal mines and gold mineralisation with profitability. Since, its inception in 2006, the company has many new projects under its belt, and it has been claiming and evaluating many exploration assets. The company has shifted its focus from exploration activities in Saudi Arabia to Arabian-Nubian Shield since 2008.
KEFI-Recent developments
The company was pleased to report encouraging assay results at the Hawiah Exploration in Saudi Arabia from the drilling programme. The drill holes have been hitting massive sulphides consistently, returned grade of 4.2 per cent copper with other base and precious metal content.
 The company has selected bank loan-based proposal for project financing of the Tulu Kapi Gold project recently received from two leading banks based out of Africa. A preliminary term sheet has been prepared and is awaiting credit approval.
The bank loan arrangement will be more favourable for the project as compared to bond lease arrangement with aggregate funding requirements of US$205.7 million.
KEFI-Operational Update for Q3 Financial Year 2019
In Tulu Kapi Gold Project (Ethiopia), the company had confirmed of all the required licensing approvals and independent reports from domain specialist needed in order to commence the development of the project and finalising the project financing for the Tulu Kapi Gold Mines. The Mines and Petroleum Ministry (Federal Democratic Republic of Ethiopia) confirmed that the government will provide support to the project development by the company.
KEFI-Stock price performance
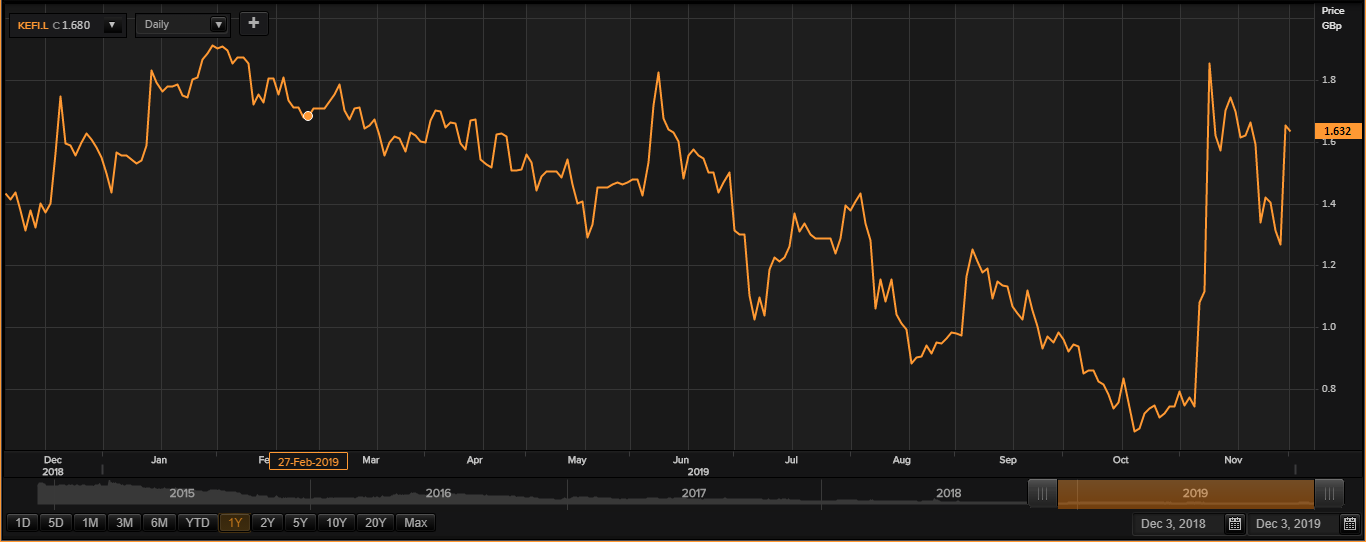
Daily Chart as at Dec-03-19, before the market close (Source: Thomson Reuters)
At the time of writing (before the market close, at 10:07 AM GMT), shares of the KEFI Minerals PLC were trading at GBX 1.632 and declined by 1.09 per cent against the previous day closing price. The shares of the company got admission for trading on the Alternative Investment Market of the London Stock Exchange on 18th December 2006. The total M-cap (market capitalisation) of the company stood at £16.49 million.
Daily Traded Volume Summary
The 5-day average daily traded shares, which exchanged hands were recorded at 41,489,575.00, which was approximately 29.34 per cent less than the 30-day average daily traded shares, which exchanged hands at the LSE (London Stock Exchange). At the time of writing, before the market close, todayâs traded volume of the shares of the company was around 30,622,282 and number of trades executed stood at 166 at the LSE (London Stock Exchange).
52-week High/Low range
In the past 52 weeks, shares of the KEFI Minerals have hovered between a high price level of GBX 2.29 (as on 6th June 2019) and a low-price level of GBX 0.58 (as on 29th October 2019). At the current level of trading, as quoted in the price chart, shares traded around 28.73 per cent below the 52-week high and were 181.37 percent above the 52-week low.
Price Performance (in percentage)
The shares of the KEFI Minerals have delivered a price return of 15.38 per cent on a Year on Year (YoY) basis and outperformed the benchmark index, as the benchmark index gave 10.54 per cent return over the same period. However, the stock has given a price return of approximately 6.62 per cent on a year-to-date (YTD) time frame and was up by approximately 108.86 per cent in the last one month.
Relative Strength Index (RSI)
The RSI indicator for the shares of the company for the 3-days, 9-days and 14-days was recorded at 77.43, 62.48 and 61.68 respectively. Also, the stockâs 30-days RSI was recorded at 59.33.
