


_10_04_2024_16_38_50_427275.jpg)


Microsaic Systems Plc (LON: MSYS)
United Kingdom based Electrical and Electronic Equipment Technology company, Microsaic Systems Plc is into business of research, development and commercialization of scientific chip-based mass spectrometry (MS) instruments, specifically designed and developed for the analysis of solid, liquid and gaseous samples. The company has developed a miniature of MS instrument in form of a desktop apparatus by deploying MS components along with chip technology. Its applications are intended for the pharmaceutical and biopharmaceutical businesses. The company got quoted on the Alternative Investment Market-segment of the London Stock Exchange on 11th April 2011.
MSYS-Recent developments
The developer of point of need mass spectrometry ("MS") instruments, Microsaic Systems plc, was pleased to announce that it has signed an exclusive distribution agreement to distribute the companyâs compact, point of need MS technology with ST Japan Inc. This technology can be deployed anywhere within laboratory or processing facilities with an integrated computer and vacuum pump.
MSYS- Business performance for H1 FY19
(Source: London Stock Exchange)
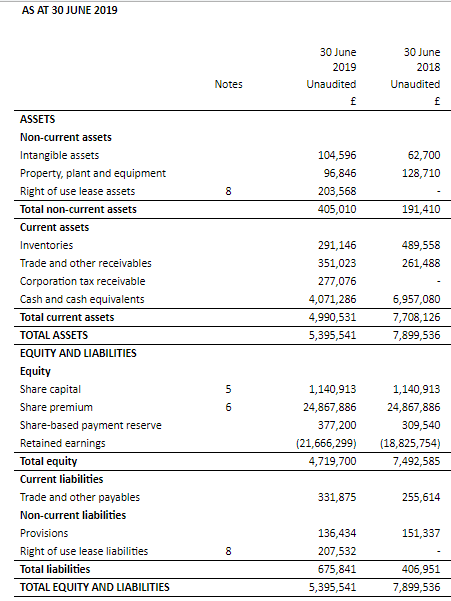
The company released its interim results for the six months period ended 30th June 2019 on 23rd September 2019. The companyâs revenue increased to 30 per cent to £0.33 million in the first half of the fiscal year 2019, in contrast to £0.25 million in the first half of the fiscal year 2018. The companyâs loss arising from operations excluding share-based payments was recorded at £1.5 million in the first half of the fiscal year 2019 as compared to £1.46 million in the first half of the fiscal year 2018 due to rise in operating expenses.
The companyâs loss before taxation surged to £1.58 million in the first half of the fiscal year 2019 as against £1.50 million reported in the same period a year ago. The companyâs Basic and diluted loss per share was recorded at 0.35 pence in the fiscal year 2019 in contrast to a loss of 0.79 pence recorded in the same period a year ago.
Despite the loss, the company has reported a decent surge in the revenues in the first half of the fiscal year 2019 but rise in cost of operations has exacerbated the company's losses at an operating level in comparison to the year-ago period. In addition, the finance costs incurred during the first half of the fiscal year 2019 stood at £8,550 against zero finance cost reported in the first half of the fiscal year 2018.
MSYS-Stock price performance
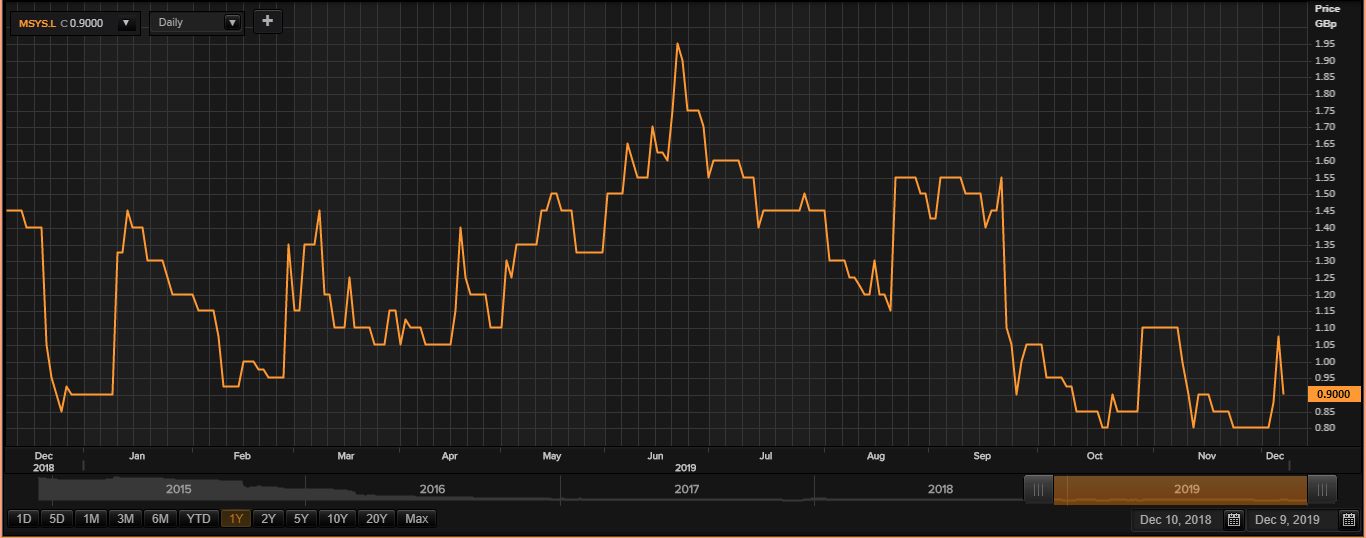
(Source: Thomson Reuters) Daily Chart as at Dec-09-19, before the market close
While writing (as on 09th December 2019, at 09:21 AM GMT), Microsaic Systems Plc shares were trading at GBX 0.90 per share on the LSE and plunged by 16.66 per cent as compared to the previous day closing price level. The companyâs market capitalisation was around £4.91 million.
MSYS shares have clocked a high of GBX 2.12 (as on 21 June 2019) and a low of GBX 0.70 (as on 18 October 2019) in the past year. At the current price point, as quoted in the price chart, the companyâs shares were trading 57.54 per cent below the 52-week high price point and 28.57 per cent above the 52-week low price point.
At the time of writing, the stockâs volume before the market close, stood at 500,000. Stock's average daily traded volume for 5 days was 1,630,421.80; 30 days- 531,209.23 and 90 days â 661,358.33. The companyâs stock beta (180 days) was 3.81, which makes it more volatile as against the benchmark index.
The average daily traded volume for 5 days surged by 206.93 per cent as against 30 daysâ average daily traded volume. At the time of writing, the shares of the company were trading above the 30-days and 60-days SMA.
In the past 1 month, MSYS shares have delivered a negative return of 2.27 per cent. Also, on a YTD (Year-to-Date) time interval, the stock surged by approximately 19.44 per cent and was down by 30.65 per cent in the last three months.
Share's RSI (Relative Strength Index) for the 30-days, 14-days and 9-days was recorded at 54.31, 69.18 and 81.07 respectively. Also, the stockâs 3-days RSI was recorded at 99.30.
Metal Tiger PLC (LON: MTR)
Metal Tiger Plc is into business of making direct equity investments and taking exposures in resource-based companies quoted on the AIM (Alternative Investment Market) market of the London Stock Exchange. Thor Mining Plc and MOD Resources Limited are some strategic investments made by the company in which the company owns significant interest. Arkle Resources plc and Greatland Gold Plc are some other important investments made by the company in terms of market portfolio.
While making any kind of strategic investment in a company or project, the company assesses feasibility and risk factors thoroughly. In addition, the company looks for a prospectâs existing track record and managementâs credentials and capability in terms of value creation, corporate governance along with subject matter expertise (domain expertise) and other ethical & professional standards. The company also analyses the pricing outlook of the commodities and the technical feasibility and the growth potential of the mining asset, expertise in exploration and development operations and other potential risks involved in and out of the system such as environmental, political or geographical risk capturing, entry and exit barriers of the industry.
Â
MTR-Exploration update
On 6th December 2019, the company was pleased to provide an update on Botswana operations by the Kalahari Metals Limited. The company was pleased to report traces of copper mineralisation from diamond drilling at Okavango Copper Project, on the Kalahari Copper Belt (Botswana). Meanwhile, the company is still awaiting results which would confirm the presence of copper sulphides. In addition, the Botswana Department of Environmental Affairs has provided authorisation to proceed with the drilling of high priority targets on KMLâs Kitlanya properties. The company has planned to drill at the structural targets in early 2020. The company found some positive results from the and geophysical surveys and recent regional soil sampling. The company shall provide with further updates shortly.Â
MTR-Business performance for H1 FY19
(Source: London Stock Exchange)
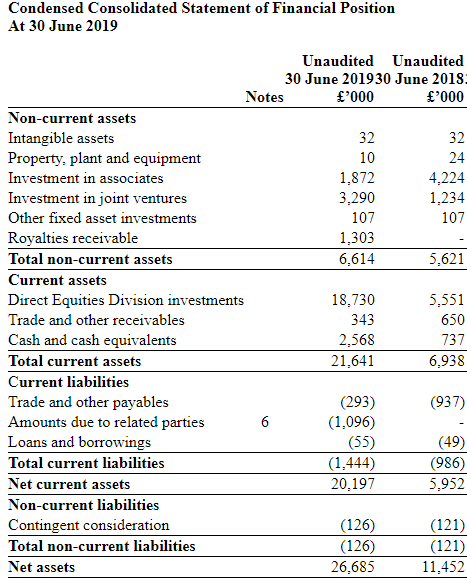
Due to fair value movement in direct equities investment, the company reported a net gain on investments of GBP 6,316 thousand in the first half of the financial year 2019 in contrast to a loss on investments of GBP 3,432 thousand in the first half of the financial year 2018.
The companyâs operating profit was recorded at GBP 4,367 thousand in the first half of the fiscal year 2019 as compared to an operating loss of GBP 5,110 thousand in the same period of the fiscal year 2018.
The companyâs Profit before taxation (PBT) was recorded was at GBP 4,521 thousand in the first half of the fiscal year 2019 in contrast to a loss before taxation (LBT) of GBP 5,047 thousand in the first half of the fiscal year 2018.
The companyâs Profit after taxation was recorded at GBP 4,521 thousand in the first half of 2019 as compared to a loss after taxation (LAT) of GBP 4,502 thousand in the first half of 2018.
The basic and diluted earnings per share of the company was at 0.37 pence in the first half of the fiscal year 2019 versus a basic and diluted loss per share of 0.41 pence in the first half of the fiscal year 2018. The cash balances of the company increased to GBP 2,568 thousand in the first half of 2019 from GBP 737 thousand in the first half of 2018.
MTR-Stock price performance
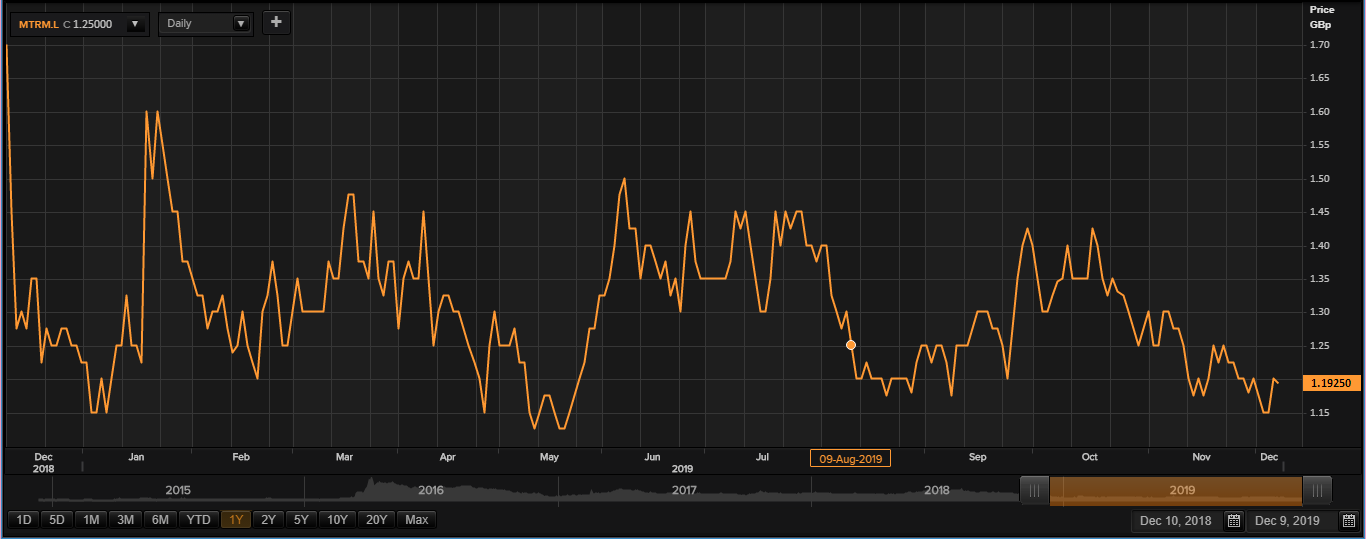
(Source: Thomson Reuters) Daily Chart as at Dec-09-19, before the market close
While writing (as on 09 December 2019, at 09:30 AM GMT), Metal Tiger PLC shares were trading at GBX 1.19 per share on the LSE and declined by 0.69 per cent as compared to the previous day closing price level. The companyâs market capitalisation was around £18.74 million.
MTR shares have clocked a high of GBX 1.65 (as on 07th December 2018) and a low of GBX 1.00 (as on 04th January 2019) in the past year. At the current price point, as quoted in the price chart, the companyâs shares were trading 27.87 per cent below the 52-week high price point and 19 per cent above the 52-week low price point.
At the time of writing, the stockâs volume before the market close, stood at 317,378. Stock's average daily traded volume for 5 days was 2,640,978.60; 30 days- 3,590,356.13 and 90 days â 2,705,719.16. The companyâs stock beta (180 days) was 1.20, which makes it more volatile as against the benchmark index.
The average daily traded volume for 5 days plunged by 26.44 per cent as against 30 days average daily traded volume. At the time of writing, the shares of the company were trading below the 30-days and 60-days SMA.
In the past 1 month, MTR shares have delivered a negative return of 7.69 per cent. Also, on a YTD (Year-to-Date) time interval, the stock plunged by approximately 4 per cent and was down by 2.04 per cent in the last three months.
Share's RSI (Relative Strength Index) for the 30-days, 14-days and 9-days was recorded at 46.28, 46.39 and 49.10 respectively. Also, the stockâs 3-days RSI was recorded at 69.82.
Â
Â
Â
