


With increasing levels of disposable income of the people, travel & leisure has become an obvious choice over other forms of entertainment. This sector is not much affected by the challenging environment. Here we are going to discuss a few stocks which are predominantly into the business of Travel & Leisure.
Comparative share price chart of TCG, TUI, JPJ
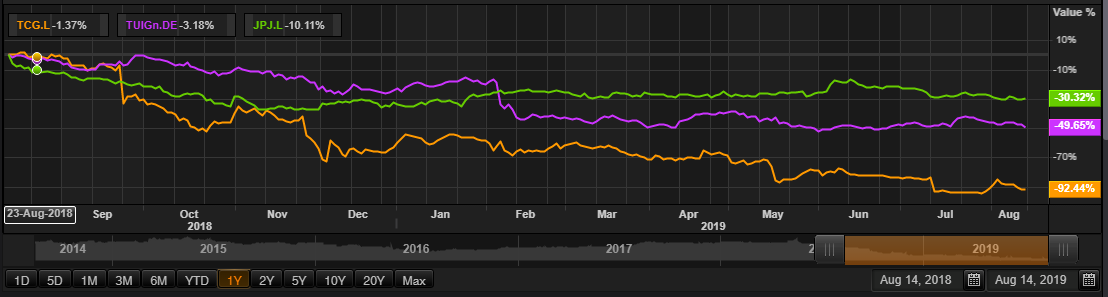
(Source: Thomson Reuters)Â
Thomas Cook Group PlcÂ
Thomas Cook Group PLC (TCG) is a UK based travel company. The company is amongst the top travel companies worldwide and is having operations in 16 countries. The company owns 105 aircraft, 200 hotels and resorts and is having an employee base of 21,000 professionals catering to the needs of 22 million customers. It is listed on the London Stock Exchange (LSE), and is a constituent of FTSE Small-Cap index.
Recent developments
The company was in talks with its key lenders for raising further £150 million to sustain its recapitalisation strategy for the coming months with expected lower cash balances. Earlier, management had announced that £750 million of additional capital is being injected into the company. This move will ensure adequate liquidity for the company.
Financial Highlights for H1 FY19 (£, million)
In the first half of the financial year 2019 ending 31st March 2019, the company's reported revenues were £3,019 million against £3,227 million in H1 2018. Revenues declined by £208 million due to the impact of currency movements and changes to IFRS 15. The underlying Gross profit stood at £599 million in H1 FY2019 versus £672 million in H1 FY2018 and underlying gross margin for the period was 19.8 per cent. The underlying EBIT loss was up by £76 million (£65 million on Like-for-like basis) to £245 million in H1 FY2019 from a loss of £170 million in H1 FY2018. The loss from operations were reported at £1,386 million in H1 FY2019 versus a loss of £215 million in H1 FY2018. Loss before tax for H1 FY2019 increased by £1,153 million to £1,456 million from a loss of £303 million in H1 FY2018. In H1 FY2019, the company paid taxes of £18 million against tax rebate of £48 million in H1 FY2018. The loss for the period for H1 FY2019 increased by £1,219 million from a loss of £255 million in H1 FY2018 to a loss of £1,474 million in H1 FY19. Net debt was up by £361 million to £1,247 million in H1 FY2019 from £886 million in H1 FY2018.
TCG Share price performance
While writing (as on 14 August 2019, at 02:42 PM GMT), TCG shares were trading at GBX 6.58 per share down by 2.57 per cent as compared to the previous dayâs closing price. The companyâs M-cap (market capitalisation) stood at around $103.86 million.
In the last one year, TCG shares have touched a high of GBX 86.05 (as on 03 September 2018) and a low of GBX 4.29 (as on 14 July 2019). At the current trading level, its shares were trading 92.35 per cent below the 52-week high price level and 53.37 per cent above the 52-week low price level.
While writing, the stockâs volume before the market close, stood at 27,196,152. Stock's average traded volume for 5 days was 56,930,132.20; 30 days- 57,806,315.07 and 90 days â 36,786,060.56. The companyâs stock beta as on date was 0.26, which means it is less volatile as against the benchmark index.
The shares of the company (at the time of writing) were trading lower than the 60-days as well as 200-days SMA, which shows a negative trend in the stock prices and could further move down from the current trading level.
In the past 1 year, TCG shares have delivered a negative return of 92.08 per cent. Also, on a YTD (Year-to-Date) basis, the stock plunged by approximately 78.04 per cent and was down by 70.27 per cent in the previous three months.
Share's RSI (Relative Strength Index) for the 30-days, 14-days and 9-days was recorded at 40.95, 42.51 and 41.74 respectively. Also, the stockâs 3-days RSI was recorded at 16.55.
Tui AGÂ
Tui AG (TUI) is a Germany-based integrated tourism group with a broad portfolio under the Group umbrella, ranging from tour operators and travel agencies to airlines, hotels and cruise liners. It is the leading European tour operator with operations spread across 180 destinations and specialises in sales and marketing, as well as holiday experiences.
Recent News
The company recently announced its results for Q3 FY19. The companyâs revenue was recorded at â¬4,745.0 million in Q3 FY19 as against â¬4,576.7 million (adjusted) in Q3 FY18. The companyâs EBITA was recorded at â¬84.1 million in Q3 FY19 as against â¬176 million (adjusted) in Q3 FY18. The companyâs underlying EBITDA was recorded at â¬219.3 million in Q3 FY19 as against â¬287 million (adjusted) in Q3 FY18. The companyâs net gain was recorded at â¬47.3 million in Q3 FY19 as against â¬104.8 million (adjusted) in Q3 FY18. The companyâs net capex and investments were recorded at â¬238.8 million in Q3 FY19 as against â¬378.4 million (adjusted) in Q3 FY18.
Â
Financial Highlights for H1 FY2019 (⬠million)
Despite an increase in turnover to â¬6,676.4 million from â¬6,565.9 million in H1 FY19, seasonal underlying EBITA loss increased to â¬300.6 million (H1 2018: â¬169.7 million loss), while reported EBITA loss increased by 70% to â¬345.9 million. The rise in loss reflects the ongoing weak demand environment in Markets & Airlines, which was affected by continued Brexit uncertainty, overcapacities in Spain arising from the shift in demand to Eastern Mediterranean and the knock-on impact of the summer 2018 heatwave. Underlying EBITDA declined from a profit of â¬25.4 million in H1 FY 2018 to a loss of â¬77.5 million in H1 FY19. Net loss for the period surged by 36.4% to â¬287.2 million. Reflecting a return to the normal seasonal pattern, net debt stood â¬1,964.1 million as on 31 March 2019. (H1 2018: â¬576 million).
Share price analysis (TUI)
While writing (as on 14 August 2019, at 02:47 PM GMT), TUI shares were trading at GBX 775 per share; and remained flat as compared to the previous dayâs closing price. The companyâs M-cap (Market Capitalisation) was recorded at around £4556.24 million.
In the last 52-weeks, TUI shares have touched a high of GBX 1,540.00 (as on 14 August 2018) and a low of GBX 686.60 (as on 29 March 2019). The companyâs stock beta as on date was 0.85, which makes it less volatile against the benchmark index.Â
JPJ Group PlcÂ
JPJ Group Plc (JPJ) is a Travel & Leisure company providing online gaming services. The company is a market leader in providing online bingo and casino games to its international consumer base. The company primarily operates in the region of UK, Nordics, Rest of Europe and ROW. The group has high retention rates with 259,664 monthly active customers. The company was formally known as Intertain Group Limited.
Recent News
On 13th August 2019, Tuesday, JPJ Group released the interim results for the six months ending 30th June 2019.
Financial Highlights for H1 FY19 (£, million)
For the first half of the financial year 2019, the companyâs gaming revenue surged by 14% to £169.5 million from £149 million in H1 FY2018. The increase in revenue was driven by solid organic growth from Vera & John segment. The companyâs Adjusted EBITDA surged by 2 per cent to £54 million in H1 FY2019 from £53 million in H1 FY2018. The increase in the revenue was offset by higher gaming taxes in the UK. The companyâs net income (continuing operations) was £5.2 million in H1 FY2019 versus a loss of £0.1 million in H1 FY2018. The companyâs net income attributable to the shareholders was £3,920 thousand in H1 FY2019 versus a loss of £1,212 thousand in H1 FY2018. The companyâs basic and diluted earnings per share stood at £0.07 in the first half of the financial year 2019.
The company has shown decent financial growth in the first half of the financial year 2019. Both the top-line and bottom-line performances for the period has improved.
The higher gaming taxes in Sweden and the UK resulted in lower growth of adjusted EBITDA, despite strong growth in revenues of the company. The companyâs marketing expenses had increased in the UK and Spain, which resulted in a low level of income.
The companyâs Botemania brand and Vera & John has been performing strongly for the period with strong revenues and adjusted EBITDA. The companyâs international markets are well placed to deliver long-term growth.
JPJ Group had signed an agreement to buy the gaming business of Gamesys Ltd and it as a transformational step to provide further benefits for customers, employees and shareholders. The company expects Gamesys acquisition will result in double-digit earnings growth.
JPJ Share price performance
On 14th August 2019, at the time of writing (before the market close, GMT 10:59 AM) JPJ Group Plc shares were hovering around GBX 657 and remained same as compared with the previous dayâs closing price.
