


Bellway PLC
Bellway PLC (Identifier: BWY) is a United Kingdom-headquartered housebuilding company. It is one of the UKâs largest housebuilders, with operations in over 22 divisions covering England, Scotland and Wales. The company offers an extensive choice of property range, extending from one-bedroom apartments to six-bedroom family homes, also providing homes to housing associations for social housing.
BWY-Financial highlights for FY19
On 15th October 2019, the company released its results for fiscal year 2019 period ended 31st July 2019. The companyâs revenue was up by 8.6 per cent to £3,213.2 million in FY19 from £2,957.7 million in FY18. The companyâs gross profit surged by 4.3 per cent to £790.2 million in FY19 as against £757.5 million in FY18. The companyâs gross margin was down by 100 basis points to 24.6 per cent in FY19 as against 25.6 per cent in FY18. The companyâs operating profit was up by 3.4 per cent to £674.9 million in FY19 as against £652.9 million in FY18. The companyâs operating margin was down by 110 basis points to 21 per cent in FY19 from 22.1 per cent in FY18. The companyâs profit before taxation surged by 3.4 per cent to £662.6 million in FY19 as against £641.1 million in FY18. The companyâs earnings per share was up by 3.4 per cent to 437.8 pence in FY19 as against 423.4 pence in FY18. The companyâs total dividend per share (proposed) surged by 5.2 per cent to 150.4 pence in FY19 as against 143 pence in FY18.
Â
BWY-Share price performance
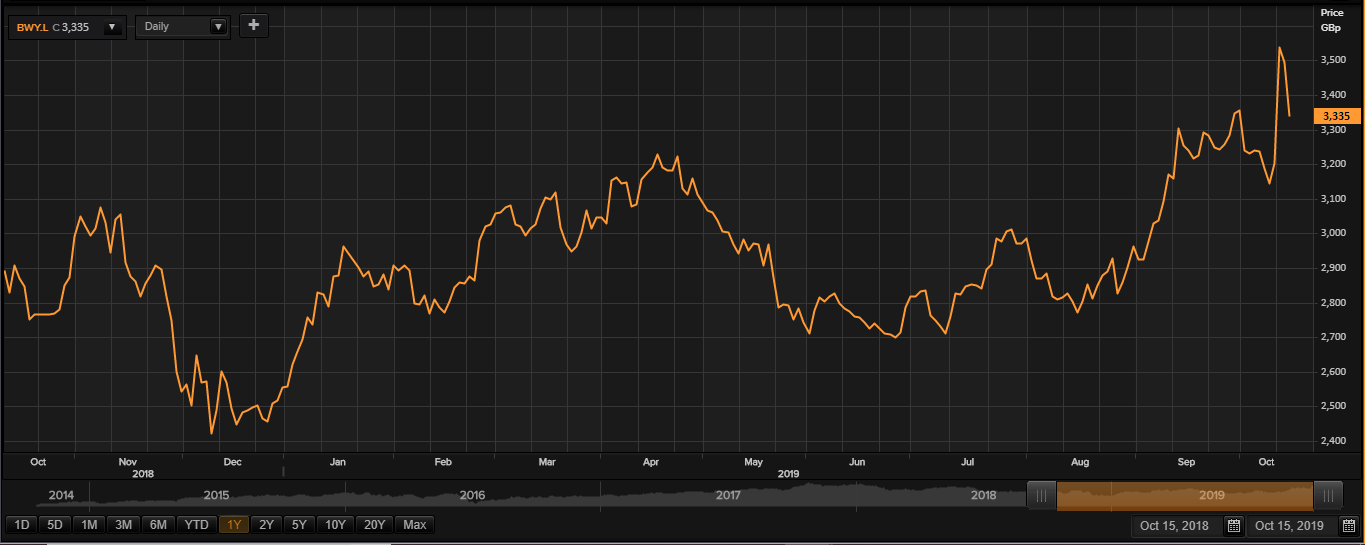
At the time of writing (at 03:39 PM GMT, as on 15 October 2019,) Bellway PLC shares clocked a price level of GBX 3,335 per share. Market Capitalisation of the company stood at £4.15 billion at the time of writing.
BWY shares have touched a peak of GBX 3,562 and a trough of GBX 2,407 in the past year.
The companyâs stock beta (5Y monthly), which is a measure of volatility of the stock, stood at 0.75, which means that the companyâs stock is less volatile in comparison to the benchmark index.
Tristel PLC
UK based company, Tristel Plc (Identifier: TSTL) is a developer, manufacturer and supplier of hygiene products, infection and contamination prevention products. The company was founded in the year 1993 and is headquartered in Snailwell, in the United Kingdom. The companyâs business segments are Contamination control, Animal Healthcare and Human healthcare. The company operates worldwide through its subsidiaries in Germany, Poland, Russia, Hong Kong, Australia, China, Japan, USA and sells its products via third-party distributors in more than thirty other countries. The company has different brands for its products. It uses Tristel brand for products related to hospital infection prevention and control. Crystel brand is used to promote products related to pharmaceutical and personal care industry. Anistel brand name is used to sell products related to animal health infection and control.
TSTL-Trading Update
The company expects its results for the FY2019 to be in line with the expectations and will be announced somewhere in mid of October 2019. The expected turnover for FY2019 stood at £26 million versus £22.2 million in FY2018. The companyâs PBT (Profit before tax before share-based payments) is expected to be £5.5 million in FY2019 as against £4.7 million in FY2018. The overseas revenue surged by 26 per cent and contributed 55 per cent of total revenues. UK revenue was up by 9 per cent year over year.
Â
TSTL-Financial highlights for H1 FY19
For the first half of the financial year 2019, the companyâs revenue surged by 12 per cent to £12,018 thousand as against £10,727 thousand in H1 FY2018. The increase in the revenue was driven by an increase in sales from overseas operations for the period. The companyâs operating profit stood at £2,189 thousand in H1 FY2019 versus £1,840 thousand in H1 FY2018. The companyâs PBT before share-based payments surged by 20 per cent from £2 million in H1 FY2018 to £2.4 million in H1 FY2019. The unadjusted PBT was at £2.2 million for the period. The companyâs basic earnings per share stood at 4.05 pence in H1 FY2019 versus 3.62 pence in H1 FY2018. The companyâs adjusted earnings per share increased by 13 per cent to 4.5 pence in H1 FY2019. It was 4 pence per share in H1 FY2018. The interim dividend in H1 FY2019 was up by 28 per cent to 2.04 pence per share from 1.6 pence per share in H1 FY2018.
Â
TSTL-Share price performance
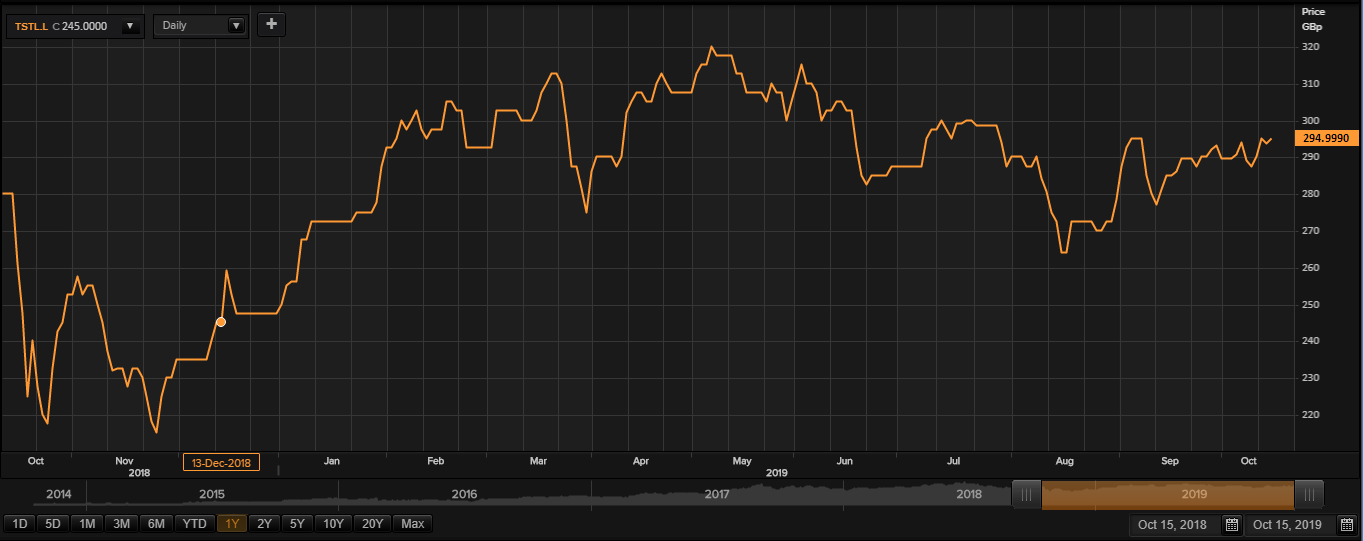
At the time of writing (at 03:41 PM GMT, as on 15 October 2019,) Tristel PLC shares clocked a price level of GBX 295 per share. Market Capitalisation of the company stood at £130.85 million at the time of writing.
TSTL shares have touched a peak of GBX 327.50 and a trough of GBX 200 in the past year.
The companyâs stock beta (5Y monthly), which is a measure of volatility of the stock, stood at 0.91, which means that the companyâs stock is less volatile in comparison to the benchmark index.
Hays PLC
Hays Plc (Identifier: HAS) is a London, the United Kingdom-based recruitment company. The companyâs geographical business is differentiated in four segments: Australia & New Zealand, Germany, United Kingdom and Ireland and Rest of World. The group has its operations across 250 offices in 33 countries.
HAS-Q1 FY20 update
Despite tougher global macroeconomic conditions and reduced business confidence, the company delivered a solid performance in the quarter in terms of net fees which were stable. The company had net cash of £90 million as on 30th September 2019.
HAS-Financial highlights for FY19
The net fees of the company surged by 5 per cent to £1,129.7 million in FY19 as against £1,072.8 million in FY18. The companyâs operating profit (excluding exceptional items) was up by 2 per cent to £248.8 million in FY19 as against £243.4 million in FY18. The companyâs cash from continuing operations surged by 8 per cent to £263 million in FY19 from £243.5 million in FY18. The companyâs profit before taxation was down by 3 per cent to £231.2 million in FY19 from £238.5 million in FY18. The companyâs basic earnings per share was down by 3 per cent to 11.1 pence in FY19 as against 11.44 pence in FY18. The companyâs core dividend was up by 4 per cent to 3.97 pence per share in FY19 as against 3.81 pence per share in FY18. The net cash of the company stood at £129.7 million in FY19 as against £122.9 million in FY18.Â
HAS-Share price performance
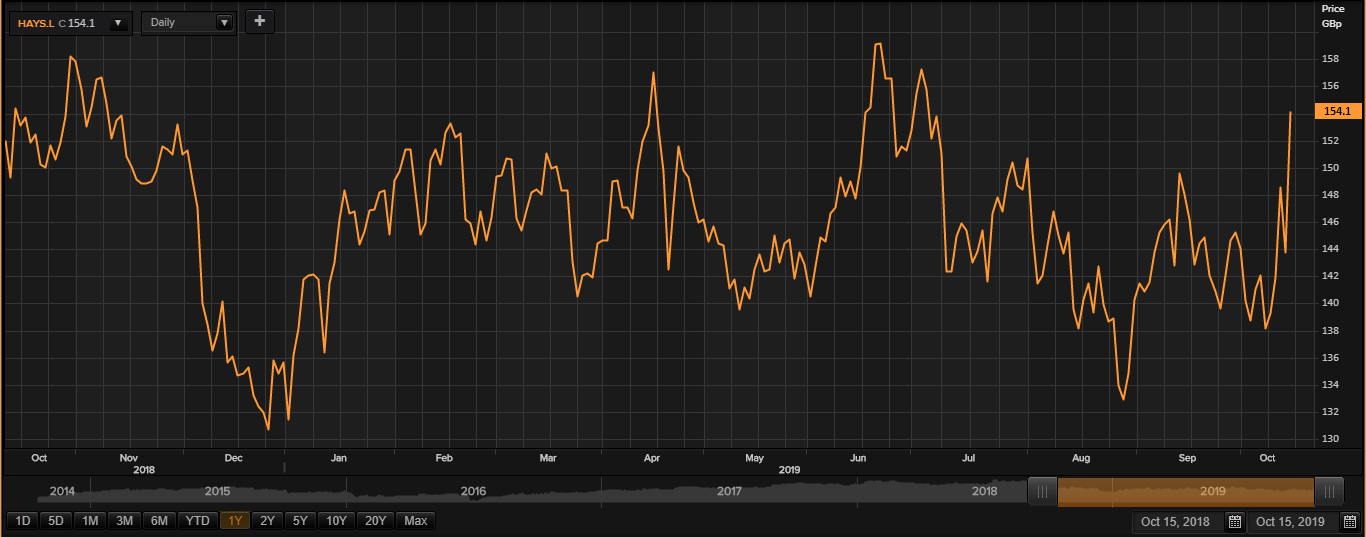
At the time of writing (at 03:43 PM GMT, as on 15 October 2019,) Hays Plc shares clocked a price level of GBX 154.10 per share. Market Capitalisation of the company stood at £2.28 billion at the time of writing.
HAS shares have touched a peak of GBX 165.65 and a trough of GBX 127.08 in the past year.
The companyâs stock beta (5Y monthly), which is a measure of volatility of the stock, stood at 0.76, which means that the companyâs stock is less volatile in comparison to the benchmark index.
Lidco Group PLC
United Kingdom-based, LIDCO Group Plc (Identifier: LID) is a provider of none-or-less invasive hemodynamic monitoring equipment, cardiac monitoring equipment and support services to hospitals.
LID-Financial highlights for H1 FY20
The companyâs product revenues were up by 10 per cent to £3.3 million in H1 FY20 as against £3.0 million in H1 FY19. The companyâs total revenues were down by 4 per cent to £3.5 million in H1 FY20 as against £3.6 million in H1 FY19. The companyâs EBITDA loss was recorded at £0.3 million in H1 FY20 as against loss £0.9 million in H1 FY19. The companyâs loss per share was recorded at 0.34 pence in H1 FY20 as against loss per share of 0.52 pence in H1 FY19. The company had cash balances of £1.2 million as on 31st July 2019. The company remains debt free.
LID-Share price performance
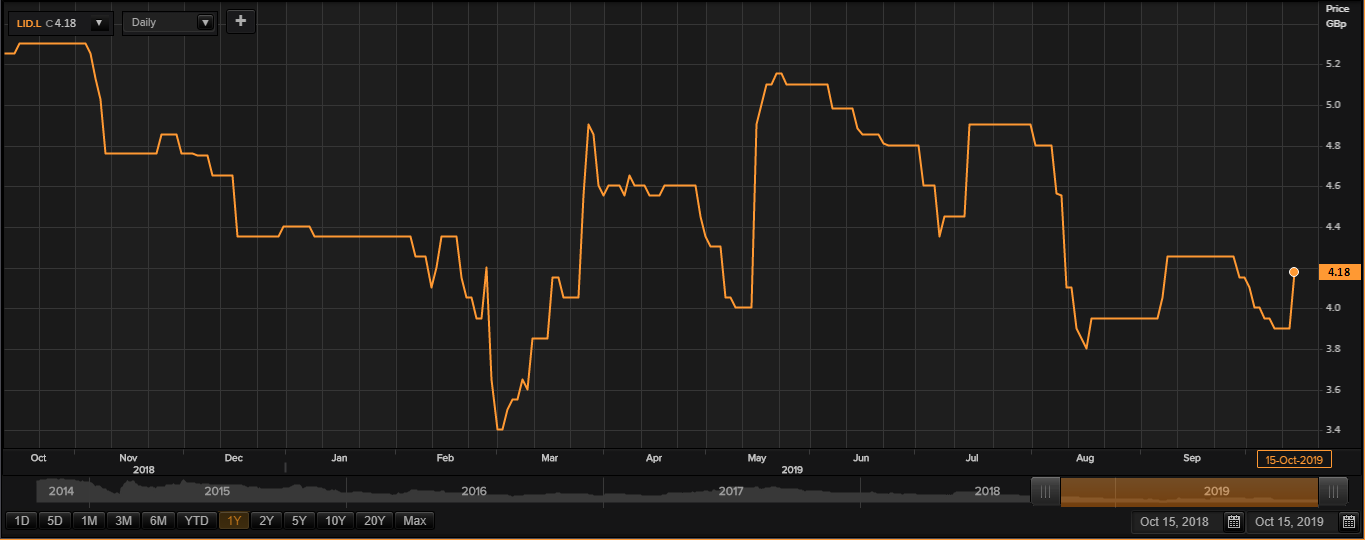
At the time of writing (at 03:45 PM GMT, as on 15 October 2019,) Lidco Group PLC shares clocked a price level of GBX 4.18 per share. Market Capitalisation of the company stood at £10.26 million at the time of writing.
LID shares have touched a peak of GBX 5.50 and a trough of GBX 3.29 in the past year.
The companyâs stock beta (5Y monthly), which is a measure of volatility of the stock, stood at 1.21, which means that the companyâs stock is more volatile in comparison to the benchmark index.
