AUS
AUS
 NZ
NZ
 UK
UK
 CA
CA
 USA
USA
 IND
IND






Summary
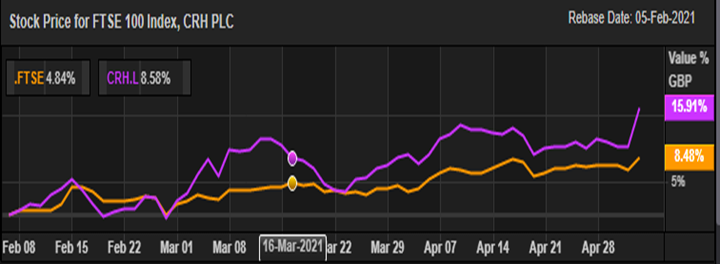
- CRH has outperformed the index and generated ~15.91 percent return in the last 3 months.
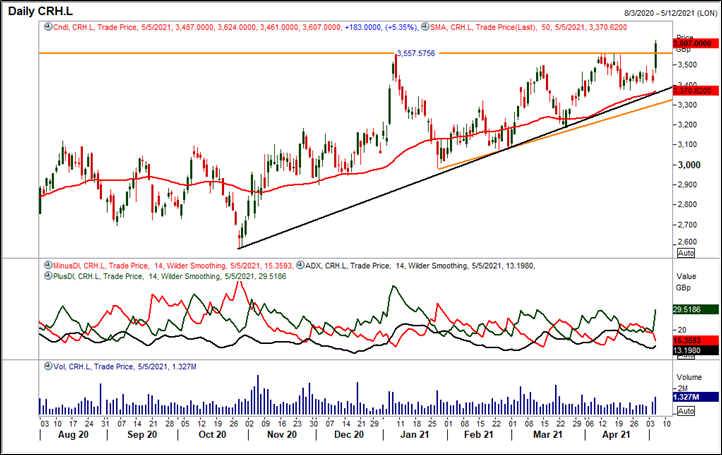
- Post breaking out of a crucial resistance level, the stock hit a new lifetime high and now taking major support from the 50-period simple moving average (SMA).
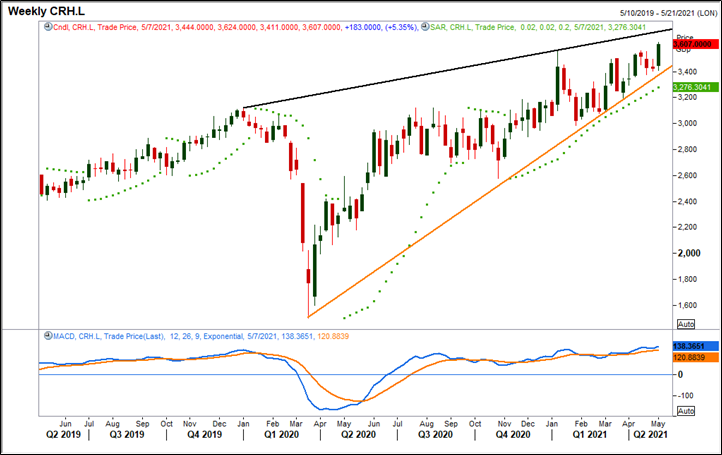
- On the weekly charts the stock prices are approaching an upward sloping trendline, which is acting as the major resistance zone on the weekly chart.
In the last four months CRH PLC (LON: CRH) bulls have witnessed a decent rally of 21.37 percent as the shares moved from the low of GBX 2,986 made on 27 January 2021 to a fresh all-time high of GBX 3,624 tested on 05 May 2021.
CRH PLC Vs FTSE 100 Index Performance Analysis
The CRH’s price has been on a good upside momentum and delivered ~15.91 percent gains in the last 3 months, while the index has returned ~8.48 percent in the same tenure. CRH outperformed the index with a decent margin based on the 05 May 2021 closing.
Source: EODHD/Others, Thomson Reuters; Analysis: Kalkine Group
The stock price has broken out an ascending triangle pattern on the daily chart at GBX 3,557.57 level on 05 May 2021 and sustaining above the upper band of the pattern. The price registered a decisive break out of the triangle pattern that suggests a change in the trend from sideways to upward. The stock prices are sustaining above an upward sloping trendline support level of GBX 3,400 (black color line in the below chart). Prices have snapped recent losing streak and settled above the psychological resistance level. There has been good participation in the rally, evident from the spike in volume in the stock in the last trading session, clearly hinting at more optimism among the market participants.
CRH on the daily chart
Source: EODHD/Others, Thomson Reuters; Analysis: Kalkine Group
Moreover, the price is trading above its 50-period SMA, acting as a crucial support level near the lower band of the triangle pattern. The trend strength indicator Average Directional Index (ADX-14 period) is trading near 13.19 level (black fluctuating line in the above chart) which indicates the neutral trend for the stock, while positive crossover between MinusDI and PlusDI indicating an upward direction for the stock.
CRH on the weekly chart
Source: EODHD/Others, Thomson Reuters; Analysis: Kalkine Group
The stock prices are trading above an upward sloping trendline support level of GBX 3,440 (orange line in the above chart) and continuously taking support of the same. Analyzing the current chart structure, it is clear that the prices are approaching an upward sloping trendline resistance zone. The prices are trading above the Parabolic SAR indicator, acting as an immediate support zone for the stock near the rising trendline. MACD (Moving Average Convergence Divergance) is also showing a positive crossover and trading above the centerline, depicting a supportive momentum for the bulls.
CRH PLC price seems to be in an upward trajectory, as represented by the above chart analysis and technical indicators outlook. Currently, the share prices are holding the key support levels. The chart pattern suggests that there might be more action expected in CRH if the price remains above the support levels.