


OptiBiotix Health PLC
Optibiotix Health Plc (OPTI) is a York, the United Kingdom-based life sciences company, engaged in the research and development into microbiome modulators. The company identifies and develops a range of products to modify the human microbiome. The group has established a pipeline of microbiome modulators, while can impact on the energy harvest, appetite suppression, and lipid and cholesterol management. The companyâs three core screening platform are OptiScreen, OptiBiome, and OptiBiotics.
Recent developments
The company recently announced that ProBiotix Health Ltd. (100 per cent owned subsidiary), has agreed upon a license agreement with Kappa Bioscience AS for experimenting with Lactobacillus Plantarum LPLDL® in a new implementation related to the heart. This agreement stands valid in 27 countries including Europe. The new cardiovascular product will be a combination of probiotic strain Lactobacillus Plantarum LPLDL® ("LPLDL® "), which helps in reducing cholesterol and blood pressure along with Kappa's proprietary K2VITAL® (Vitamin K2).
The manufacturing and development costs would be borne by Nutrilinea (ProBiotix's preferred development and production partner) in Italy (Milan). The new plus existing distribution networks shall be utilised by ProBiotix and Kappa for commercialising the product.
Kappa (Norway) manufacture vitamin K2 which is considered as the purest form of Vitamin K2, cost-effective and efficient dosing. The product is marketed under the brand K2VITAL®â by distribution channels which operate globally. This product is amongst the most widely recognised brands of vitamin K2.
The resulted product optimises the complementary modes of action in both its constituents (LPLDL® and K2VITAL®) to reduce heart-related risk factors such as cholesterol and blood pressure. Calcification of blood vessels leads to arterial hardening which in turn makes one highly prone to cardiovascular disease morbidity and mortality. LPLDL® lowers these risk factors while K2VITAL® doesnât let calcium to deposit in the blood vessels, thereby improving vascular health. This combination leads to a great product which has the potential to eliminate heart-related risk factors.
 Financial Highlights for Financial Year 2018 (£)

(Source: Companyâs filing, LSE)
Â
The companyâs reported revenue increased from £191 thousand in 2017 to £514 thousand in 2018. Most of this income (£434 thousand) was generated in H2 FY18 (June to November 30, 2018). The operating loss stood at £1,499 thousand, which was £628 thousand lower than the same period of last year data of (£2,127) thousand. In FY2018, the loss for the period stood at £1,893 thousand. Basic loss per share from continued operations was 2.33 pence, a significant decrease from the last year profit per share of 2.43 pence. At November 30, 2018, the Company had cash in the bank of £1.33 million.
The Board recognises the importance of KPIs in driving appropriate behaviour and enabling of Groupâs performance. For the year to 30 November 2018, the primary KPIâs were the completion of commercial agreements and the expansion of the Optibiotic platform. The Group intends to review the following non-financial KPIs going forward â Customer relationships, IP and trademark registrations, Service quality and brand awareness, and Attraction, motivation and retention of employees.
The company had announced the appointment of Stephen Prescott as Chief Executive Officer (CEO) of its wholly owned subsidiary, ProBiotix Health Ltd. ProBiotix was created to develop science-based healthy bacteria called probiotics to reduce cardiovascular risk.
In 2019, the company anticipates further revenue progress, due to the current deals which will contribute to the full-year revenue progress. The group will invest in its clinical and scientific studies. The current consensus is that Brexit will not affect the regulations that are relevant to the business.
Share price performance
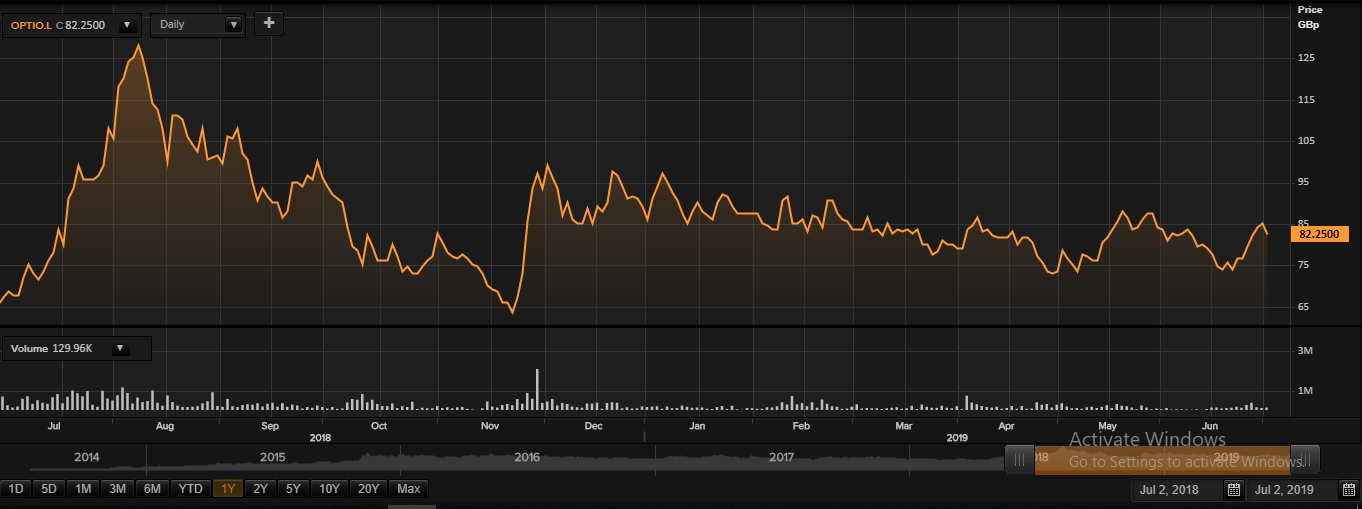
Daily Chart as at July-02-19, before the market close (Source: Thomson Reuters)
At the time of writing (before the market close, at 02:14 PM GMT), shares of the Optibiotix Health Plc were trading at GBX 82.25 and declined by 3.23 per cent against the previous closing price. As on Aug-05-2014, its shares got admitted to the Alternative Investment Market of the London Stock Exchange for trading.
Volume Summary
The 5-day average daily shares exchanged hands were stood at 195,407.40, which was around 72.24 per cent above the 30-day average daily volume exchanged hands at the London Stock Exchange. Todayâs volume in the stock stood at 129,957 with 26 trades took place at the London Stock Exchange (before the market close).
52wk H/L range
In the past 52-weeks, shares of the Optibiotix Health Plc have registered a high price of GBX 133.25 as on Aug 08, 2018, and a low price of GBX 61.42 as on Nov 22, 2018. At the current trading level, as quoted in the price chart, its shares were trading 38.27 per cent below the 52-week high price level and 33.91 per cent above the 52-week low price level.
Price Performance (%)
On a Y-o-Y basis, shares of the Optibiotix Health Plc have delivered a positive price return of 29.77 per cent but was not able to beat the benchmark index over the same period. However, on a year-to-date basis, the stock has recorded a negative price return of approximately 6.59 per cent as against the negative return of 16.18 per cent of the benchmark index. For the past three months, the stock has generated 7.59 per cent positive returns as against 5.01 per cent positive returns of the benchmark index.
Simple Moving Average (SMA)
The shares of the company (at the time of writing) were trading above the 30-days and 60-days SMA, which shows a positive trend in the stock price movement and could further move up from the current trading levels.
Relative Strength Index (RSI)
Share's RSI for the 30-days, 14-days and 9-days stood at 52.11, 55.05 and 56.75 respectively. Also, the stockâs 3-days RSI stood at 54.31. The volatility of the stock for 200 Days, 90 Days, 30 Days stood at 52.62, 40.20 and 35.92 respectively.
Â
InnovaDerma PLC
InnovaDerma PLC (IDP) develops a variety of treatments for hair care, skin-tanning and rejuvenation. The group has a global presence in Europe, US, Australasia, Asia and Africa. Its product portfolio includes Hair Laser Starter Kit, Hair Treatment Pack, Bio-Cleansing Shampoo, Conditioners, Scalp Therapy Treatment, Scalp Serums, Deep Cleansers for Scalp and Body, Hair Treatment Pack, Shampoos, Hair Follicle Boost Therapy, BioPlex Scalp Serum, Scalp and Body Exfoliating Spa, Instant Hair Building Fiber, Skin Primer& Shader.
Trading update for FY19
The company announced that the company has done well, and the results are in accordance with the boardâs expectations. The revenue of the company stood at £13 million in FY2019, surged by 21 per cent as against £10.7 million in FY2018. The company expects the profit before tax to double from last year; it stood at £0.67 million in FY2018. The company optimised its inventory and supply chain management which resulted in improved gross margins significantly. The Gross margins increased by 500 bps Y-o-Y. This growth can be attributed to the business model which enables the company to reduce overheads as the model has scalability and agility. The company has cash balances of more than £1.7 million which makes it financially sound. The company is expected to announce results in September this year.
GrowLase, an FDA approved helmet which supports hair growth and reduces hair fall, will be launched soon by online mode, retail channels and TV Home Shopping networks.
Financial Highlights for H1 FY2019 (£)
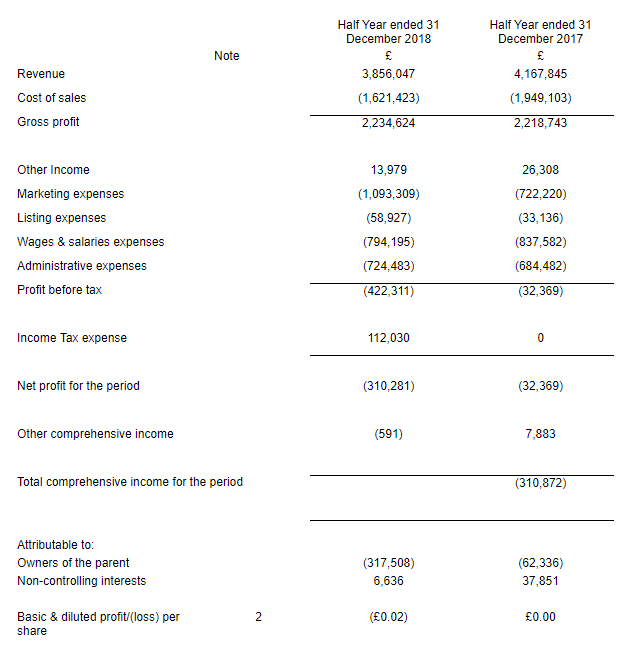
(Source: Companyâs filings, LSE)
The companyâs revenue slightly declined by 7.48 per cent to £3.9 million for this period as against £4.2 million in H1 FY18. This decline can be attributed to change Facebookâs methodology of advertising which was reflected in DTC sales. The companyâs loss before tax stood at £0.4 million for the period as against £0.03 million in H1 FY18. This increase was due to the rise in online marketing costs, social media and product development costs. The companyâs gross margin surged to 58.3 per cent for this period as against 53.3 per cent in H1 FY18 due to improved retail sales. The group has zero external borrowings. The board has not declared Dividend as of now. The cash balance reported by the company stood at £0.7 million at the end of the reported period. The funds are being utilised on online marketing.
Share price performance
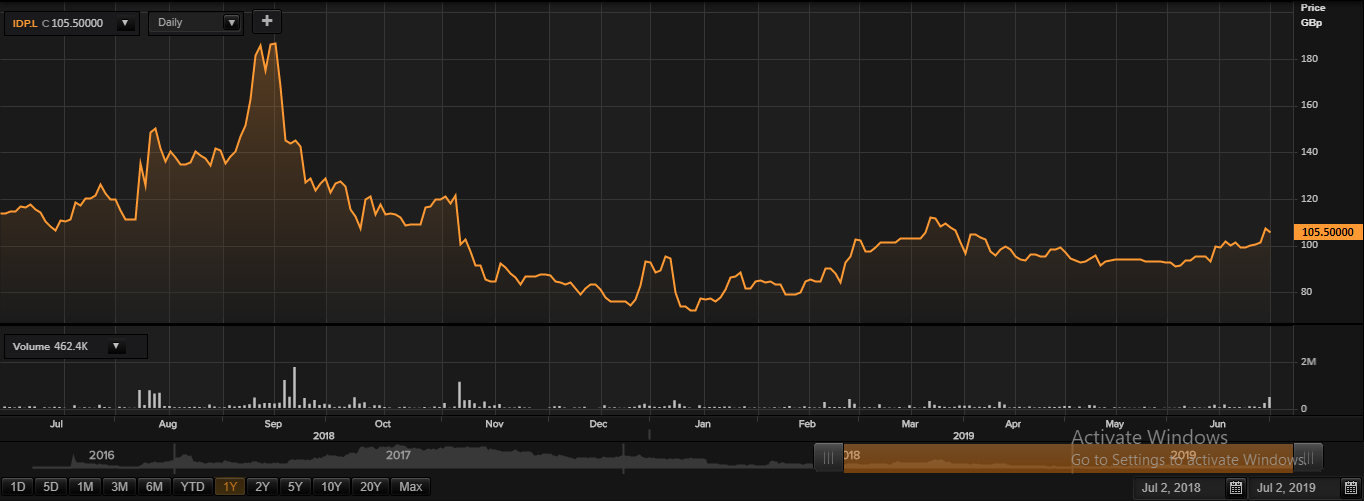
Daily Chart as at July-02-19, before the market close (Source: Thomson Reuters)
At the time of writing (before the market close, at 02:14 PM GMT), shares of the InnovaDerma PLC Limited were trading at GBX 105.50 and declined by 1.40 per cent against the previous closing price.
Volume Summary
The 5-day average daily shares exchanged hands were stood at 80,182.40, which was around 81.79 per cent above the 30-day average daily volume exchanged hands at the London Stock Exchange. Todayâs volume in the stock stood at 462,400 with 146 trades took place at the London Stock Exchange (before the market close).
52wk H/L range
In the past 52-weeks, shares of the InnovaDerma PLC have registered a high price of GBX 209.60 as on Sep 19, 2018, and a low price of GBX 70.00 as on Jan 17, 2019. At the current trading level, as quoted in the price chart, its shares were trading 49.66 per cent below the 52-week high price level and 50.71 per cent above the 52-week low price level.
Price Performance (%)
On a Y-o-Y basis, shares of the InnovaDerma PLC have delivered a negative price return of 5.73 per cent and performed poorly than benchmark index over the same period. However, on a year-to-date basis, the stock has recorded a positive price return of approximately 29.70 per cent and was able to beat the index quite comfortably. For the past three months, the stock has generated 5.94 per cent positive returns as against 3.40 per cent positive returns of the benchmark index.
Simple Moving Average (SMA)
The shares of the company (at the time of writing) were trading above the 30-days and 200-days SMA, which shows a positive trend in the stock price movement and could further move up from the current trading levels.
Relative Strength Index (RSI)
Share's RSI for the 30-days, 14-days and 9-days stood at 63.15, 74.27 and 80.07 respectively. Also, the stockâs 3-days RSI stood at 94.85. The volatility of the stock for 200 Days, 90 Days, 30 Days stood at 62.46, 41.18 and 30.04 respectively.
