


The retail industry contains any business or individual involved with selling products directly to consumers. The retail sector includes department stores, market stalls, door-to-door salespeople, supermarkets, shops, and internet retailers.
The supermarket sales together increased by 1.4 per cent in the industry data published for 12 weeks to 16th June. The four major supermarket companies which include Tesco, J Sainsbury, Asda and WM Morrisons lost their market shares. All the companies faced tough competition by the German-based companies Aldi and Lidl.
As per the released data, Tesco remained UKâs biggest supermarket but had lost 0.4 percentage points in the grocery market to 27.3 per cent. J Sainsbury Plc remained the second largest supermarket after Tesco. The companyâs market share fell by 0.3 percentage points to 15.3 per cent. The company sales also declined by 0.6 per cent for the period.
Asdaâs sales fell by 0.1 per cent for the period which led to a decline in market share by 0.2 percentage points to 14.9 per cent. Â The market shares of WM Morrison Supermarket PLC declined to 10.4 per cent and the sales dipped by 0.5 per cent for the period.
Aldi and Lidl sell products at discounted prices which led to an increase in the market share of both the companies. Aldi market share was up by 0.5 percentage points to 7.9 per cent with an increase in sales by 9.3 per cent. Lidl sales surged by 9.3 per cent for the period and market share was up by 0.3 percentage points to 5.7 per cent.
Tesco Plc (LSE:TSCO)
Tesco PLC (LSE:TSCO) is a British-based retail company and is one of the world's largest retailers of consumer goods. The group primarily operates as a grocery retailer but also provides insurance and retail banking services. Operations are primarily differentiated in two operating divisions: Retail, which includes retailing and associated activities, and Tesco Bank, which comprises of banking and insurance services.
Q1 Trading Update FY2020
On a constant rate basis, the companyâs total reported revenue increased by 0.4 per cent to £13,978 million as compared to the corresponding period last year. In the UK & ROI segment, revenue surged by 1.3 per cent to £11,168 million against the previous year same period data. In central Europe segment, revenue declined by 7.9 per cent to £1,296 million, due to the store closures. In Asia segment, revenue increased by 2.6 per cent to £1,244 million as compared with the corresponding period of last year, driven by the growth in the Bangkok area. In Tesco bank segment, sales were down by 1.9 per cent to £270 million. On a like for like basis, the companyâs total sales climbed by 0.2 per cent. This was because of the sales from the UK & ROI business surged by 0.8 per cent, Central Europe segment was down by 4.9 per cent, and Asia market surged by 0.1 per cent.
Financial Highlights (FY2019, £million)
The company reported revenue (excluding VAT, including fuel) of £63,911 million for the Financial Year 2019 as compared to £57,493 million in the financial year 2018. There was an increase of 11.2 per cent in the revenue based on the actual exchange rate, due to a rise in sales of UK & ROI segment of the company. The companyâs reported operating profit had increased significantly by 34 per cent based on AER to £2,206 million in FY19 as compared to £1,646 million in FY18. The companyâs statutory profit before tax was increased to £1,674 million in FY2019 as compared to £1,300 million in FY2018, up by 28.8 per cent based on AER basis as compared to the last year. The statutory basic earnings per share stood at 13.65 pence in FY2019 against 12.15 pence in FY2018. The statutory diluted earnings per share stood at 13.55 pence in FY2019 against 12.11 pence in FY2018. The companyâs dividend per share was increased by 92.3 per cent based on AER from 3.00 pence in FY2018 to 5.77 pence in FY2019.
Tesco Plc Share Price Performance
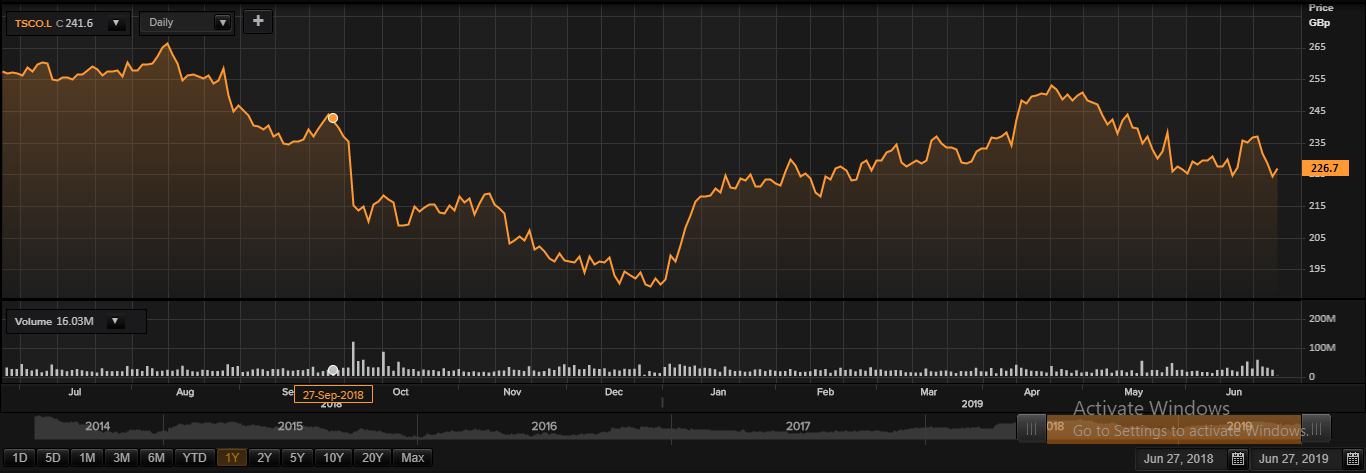
Daily Chart as at June-27-19, before the market closed (Source: Thomson Reuters)Â
On 27th June 2019, at the time of writing (before the market close, GMT 9:18 AM), TSCO shares were trading at GBX 226.70, up by 1.12 per cent against the previous day closing price.
Stockâs 52 weeks High and Low is GBX 266.80/GBX 187.05. From the previous three months, Tesco Plc share price was down by 1.97 per cent, and in the last one year, the stock was down by 12.83 per cent. Stockâs average traded volume for 5 days was 32,849,956.00; 30 days â 24,177,375.57 and 90 days â 20,980,091.59. The average traded volume for 5 days was up by 35.87 per cent as compared to 30 days average traded volume. The companyâs stock beta was 1.17, reflecting higher volatility as compared to the benchmark index. Total outstanding market capitalisation was around £21.97 billion, with a dividend yield of 2.57 per cent.
J Sainsbury PLC (LSE:SBRY)
J Sainsbury PLC (LSE:SBRY) is a British chain of supermarkets, operating primarily in the United Kingdom. The company engages in grocery-related retailing and retail banking with interests in property as well. The company's brands include Sainsbury's groceries, Argos, Tu, Sainsbury's Home, Habitat and Sainsbury's Bank. The group's operations are divided into four reportable business segments being Retail â Food, General Merchandise and Clothing, Financial Services & Property Investment.
Recent News
On 11th June 2019, J Sainsbury Plc announced the selection of Jim Brown as Sainsbury's Bank CEO effective from 19th June 2019.
Financial Highlights â FY2019
On May 01, 2019, the retailer reported its full-year financial results for the period ended on March 09, 2019. The Groupâs underlying revenue including VAT for the period FY19 surged by 2.1% to £32,412 mn against the FY18 revenue. Underlying before tax profit surged by 7.8 per cent to £635 mn, primarily because of strong food performance and reduced interest costs. Also, the underlying retail operating profit increased by 10.7 per cent to £692 mn and Sainsburyâs underlying retail sales (including VAT) surged by 2.1 per cent to £31,871 mn. Statutory Post-tax profit stood at £219 mn and declined by 29.1% from £309 mn in FY18. The board of the retailer-proposed a final dividend of 7.9 pence, and with this, the total dividend per share for FY19 stood at 11.0 pence and witnessed a surge of 7.8% against FY18.
J Sainsbury PLC Share Price Performance
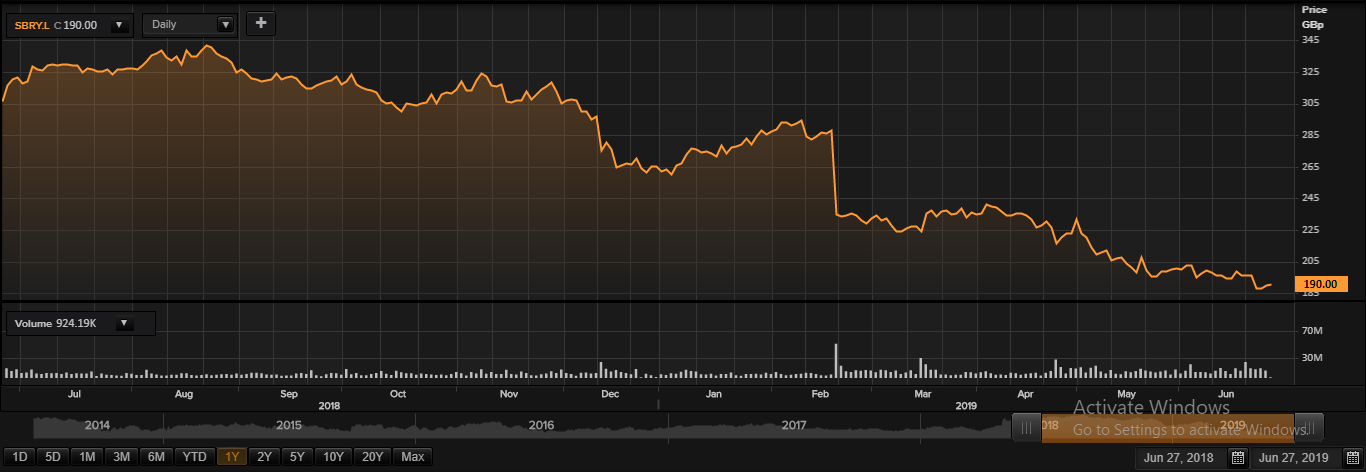 Daily Chart as at June-27-19, before the market closed (Source: Thomson Reuters)Â
On 27th June 2019, at the time of writing (before the market close, GMT 9:23 AM), SBRY shares were trading at GBX 190.00, up by 0.32 per cent against the previous day closing price.
Stockâs 52 weeks High and Low is GBX 341.80/GBX 185.30. From the previous three months, J Sainsbury PLC share price was down by 19.51 per cent, and in the last one year, the stock was down by 38.10 per cent. Stockâs average traded volume for 5 days was 15,176,917.60; 30 days â 10,835,429.27 and 90 days â 10,457,993.98. The average traded volume for 5 days was up by 40.07 per cent as compared to 30 days average traded volume. The companyâs stock beta was 0.98, reflecting slightly lower volatility as compared to the benchmark index. Total outstanding market capitalisation was around £4.1 billion, with a dividend yield of 5.81 per cent.
WM Morrison Supermarkets PLC (LSE:MRW)
WM Morrison Supermarkets PLC (LSE:MRW) is a United Kingdom-based company engaged in the business of retail supermarket store and associated activities. WM Morrison is focused on helping customers to save money on a daily basis by providing permanently low prices product offerings. The company sells its product under its Morrisons brand.
In Q1 FY2020, the companyâs like-for-like (LFL) sales surged by 2.3 per cent (excluding fuel). The increased sales were driven by an increase in sales from the retail business by 0.2 per cent and wholesale business contributed with 2.1 per cent for the period. Total sales for the period increased by 2.9 per cent including fuel and 2.4 per cent excluding fuel. The sales from retail business remained strong and the company was able to deliver positive like-for-like sales in Q1 FY20 for the fourth consecutive year. There was economic and political uncertainty impacting the confidence of consumers. Sales during the festive season (Easter period) remained strong as LFL was up by 1.7 per cent on last year and 3.4 per cent on a two-year basis. The companyâs wholesale business also made significant growth in Q1 FY2020.
WM Morrison Supermarkets PLC Share Price Performance
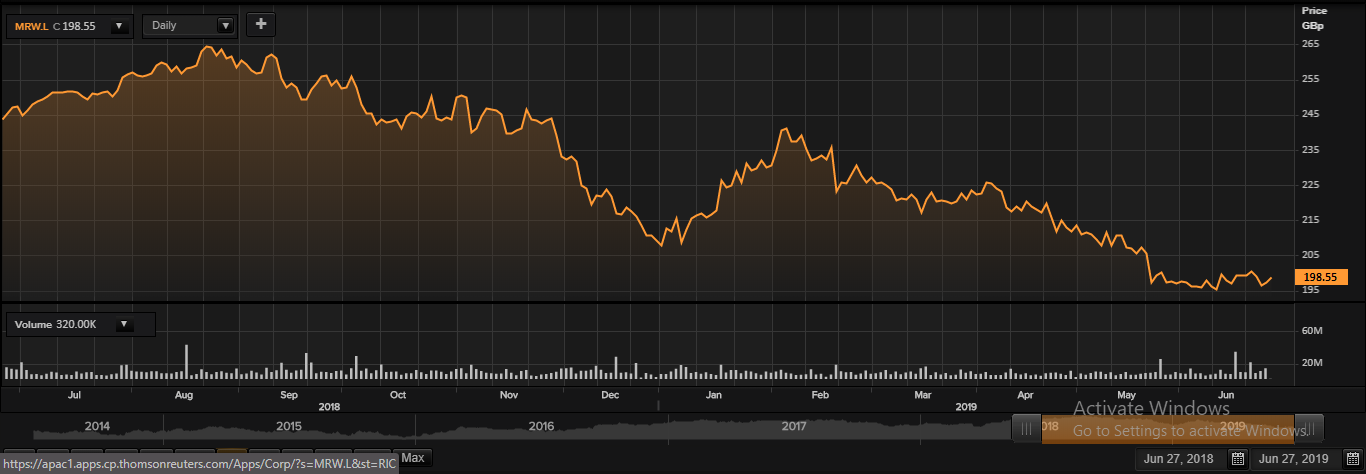 Daily Chart as at June-27-19, before the market closed (Source: Thomson Reuters)Â
On 27th June 2019, at the time of writing (before the market close, GMT 9:29 AM), MRW shares were trading at GBX 198.55, up by 0.63 per cent against the previous day closing price.
Stockâs 52 weeks High and Low is GBX 265.33/GBX 192.15. From the previous three months, WM Morrison Supermarkets PLC share price was down by 10.34 per cent, and in the last one year, the stock was down by 18.96 per cent. Stockâs average traded volume for 5 days was 11,849,402.20; 30 days â 9,343,600.37 and 90 days â 8,035,917.56. The average traded volume for 5 days was up by 26.82 per cent as compared to 30 days average traded volume. The companyâs stock beta was 0.73, reflecting lower volatility as compared to the benchmark index. Total outstanding market capitalisation was around £4.72 billion, with a dividend yield of 3.35 per cent.
