


Royal Mail Group Plc
Royal Mail Group Plc (RMG) is an Industrial Transportation company having operations globally. The company presently operates in around 44 countries worldwide. The company is having an employee base of 160,000 people and is delivering over 1.8 billion parcels and 14 billion letters annually. The companyâs operations are divided into 2 businesses being General Logistics Systems (GLS) and UK Operations. In the United Kingdom, the company operates under Parcelforce Worldwide and Royal Mail brands. The company is targeting expansion outside Europe through acquisitions.
Financial Highlights for FY19
In the financial year ending 31 March 2019 (53 weeks), the companyâs reported revenue was up by 4.02 per cent to £10,581 million against £10,172 million in FY2018 (52 weeks). The increase in revenue was driven by the impact of the 53rd week in UKPIL segment and high revenue from parcels in the UKPIL and GLS segments.
The operating profit before transformation costs stood at £474 million in FY2019 against £236 million in FY2018. The operating profit after transformation costs stood at £341 million in FY2019 against £123 million in FY2018. The reported operating profit for the FY2019 was £160 million against £66 million in FY2018. The companyâs earnings before interest and taxation (reported) were £175 million for FY2019 versus £137 million in FY2018.
The companyâs reported profit before taxation was £241 million for FY2019 versus £212 million in FY2018. The company paid a tax expense of £66 million in FY2019 against a tax rebate of £46 million in the FY2018. The reported profit for the year declined by 32.17 per cent to £175 million in FY2019 from £258 million in FY2018. The companyâs reported basic earnings per share for FY2019 stood at 17.5 pence versus 25.9 pence in FY2018. The companyâs diluted earnings per share for FY2019 stood at 17.5 pence versus 25.7 pence in FY2018.
Share price performance
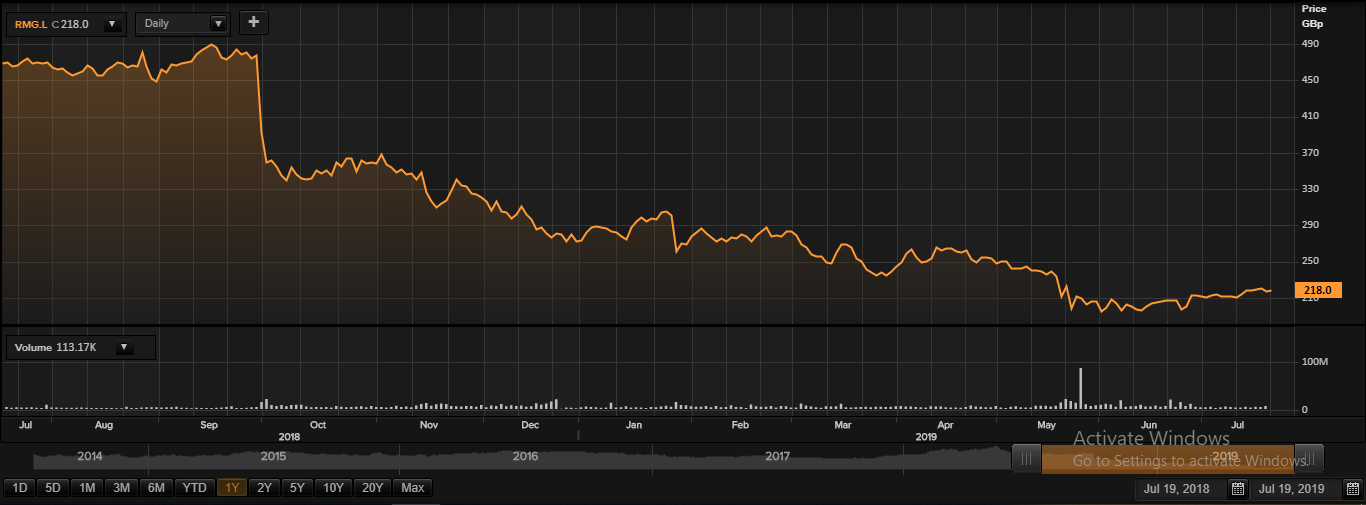
Daily Chart as at July-19-19, before the market close (Source: Thomson Reuters)
On July 19, 2019, at the time of writing (before the market close, at 08:45 AM GMT), Royal Mail Group shares were trading at GBX 218, up by 0.87 per cent against the previous day closing price. Stock's 52 weeks High and Low are GBX 492.50 /GBX 192.00. At the time of writing, the share was trading 55.73 per cent lower than the 52w High and 13.54 per cent higher than the 52w low. Stockâs average traded volume for 5 days was 4,510,838.80; 30 days â 6,332,953.43 and 90 days â 6,956,872.37. The average traded volume for 5 days was down by 28.77 per cent as compared to 30 days average traded volume. The companyâs stock beta was 0.74, reflecting lower volatility as compared to the benchmark index. The outstanding market capitalization was around £2.14 billion, with a dividend yield of 11.57 per cent.
Â
Anglo American PLC
Anglo American PLC (AAL) is headquartered in London and was founded in 1917. Its principal operations include mining, exploring and processing of metal and minerals globally. The group mainly Exploreâs metals such as copper, platinum, diamonds, iron, nickel, manganese and thermal coal. The group has mining operations in Africa, the Americas and Australia.
Production update for Q2 ended 30 June 2019
The company's diamond production at De Beers' mine declined by 14 per cent to 7.7 million carats for Q2. The company increased its platinum production by 3 per cent to 520,300 oz for the period. The company's Metallurgical coal production increased by 11 per cent and thermal coal production declined by 8 per cent for the period.
Financial Highlights-FY18
Driven by an increase in the polished diamonds demand from the US and Chinese retailers in the first half, revenue for the financial year 2018 increased by 5 per cent to $27,610 million. Underlying EBITDA rose by 4 per cent to $9,161 million. The company delivered profit attributable to equity shareholders of $3,549 million in the financial year 2018, representing an increase of 12 per cent in comparison with the last year. The companyâs reported earnings per share for 2018 was $2.80, which was 13 per cent more than 2017 reported earnings per share of $2.48. In FY18, free cash flow stood at $3.2 billion, down by 36 per cent. Driven by disciplined capital allocation which helped to strengthen the balance sheet of the company, net debt reduced by 37 per cent to $2.8 billion in the financial year 2018, while net debt/underlying EBITDA was 0.3x. With the proposed dividend of 51 cents per share, the total dividend per share stood at $1.00 for the year 2018.
Share price performance
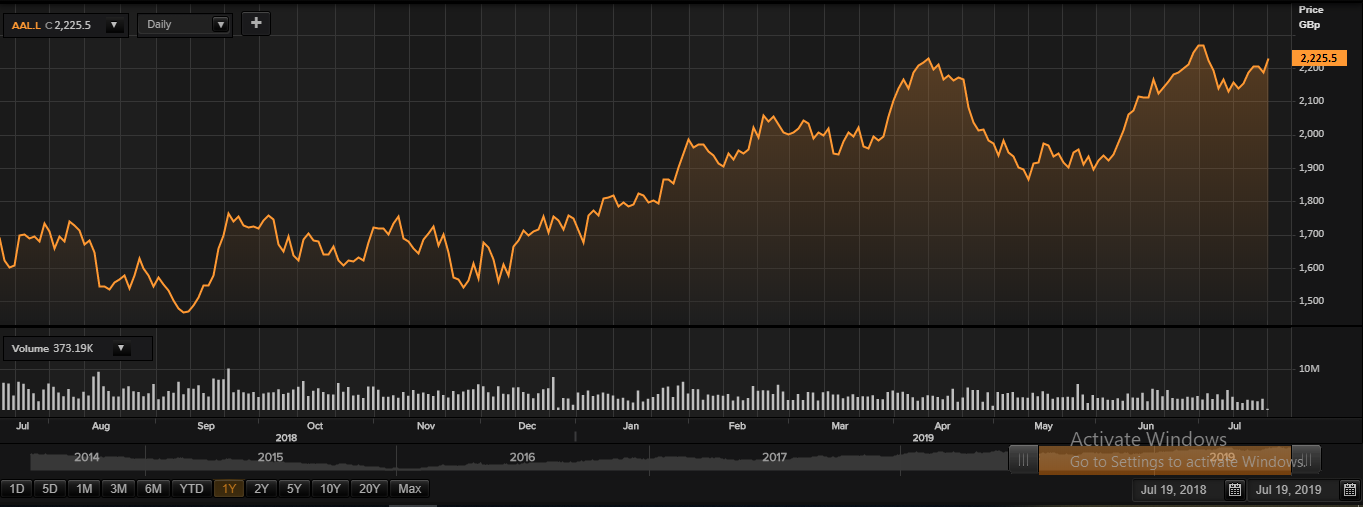
Daily Chart as at July-19-19, before the market close (Source: Thomson Reuters)
On July 19, 2019, at the time of writing (before the market close, GMT 09:04 AM), Anglo American shares were trading at GBX 2,225.50, up by 1.87 per cent against the previous day closing price. Stock's 52 weeks High and Low is GBX 2,294.00/GBX 1,433.64.
Â
EasyJet Plc
EasyJet PLC (EZJ) is a British-based low-cost European point-to-point airline company. The company is known for delivering low fares, which is achieved through operational efficiency on point-to-point routes. The company has four geographic segments, which are differentiated according to the origin country. The segments include the United Kingdom, Southern Europe, Northern Europe and Other.
Trading Statement for Q3 ended - 30 June 2019
The companyâs total revenue stood at £1,761 million, up by 11.4 per cent in Q3 FY19. The passenger revenue of the company stood at £1,387 million (up by 10.7 per cent), and ancillary revenue stood at £374 million (surged by 14.3 per cent) by the end of the period. This period saw a rise in the passenger numbers by 8 per cent to 26.4 million, due to the increased capacity of 10 per cent (28.8 million seats). The companyâs turnover per seat (as expected) surged by 0.7 per cent at CCY (constant currency) basis in Q3.
Financial Highlights for H1 FY19Â
During the period under review, the company's first-half results were in line with management expectations. During the first half of the FY19, the airline group brought extra focus on its costs, customers, and on operational initiatives to support the remaining half of the FY19. Revenue during the H1 FY19 improved by 7.3% to £2,343 mn against £2,183 mn in a year-ago period. This growth was driven by capacity expansion in Berlin and benefited by foreign exchange gains. However, it was partly offset by the move of Easter in April, this year. Total revenue per seat slumped to £50.71 against £54.10 recorded in the H1 FY18.
Headline cost per seat surged in H1 FY19 to £56.66 against the cost of £54.53 recorded in the H1 FY18. The cost surged mainly because of the rise in the fuel prices, foreign exchange impacts and underlying cost inflation. Headline pre-tax loss stood at £275mn as compared to the loss of £18mn in the year-ago period, primarily because of the increased costs and slow growth in the revenue. Headline basic loss per share stood at 56.1 pence against the loss per share of 3.3 pence per share in H1 2018.
Share price performance
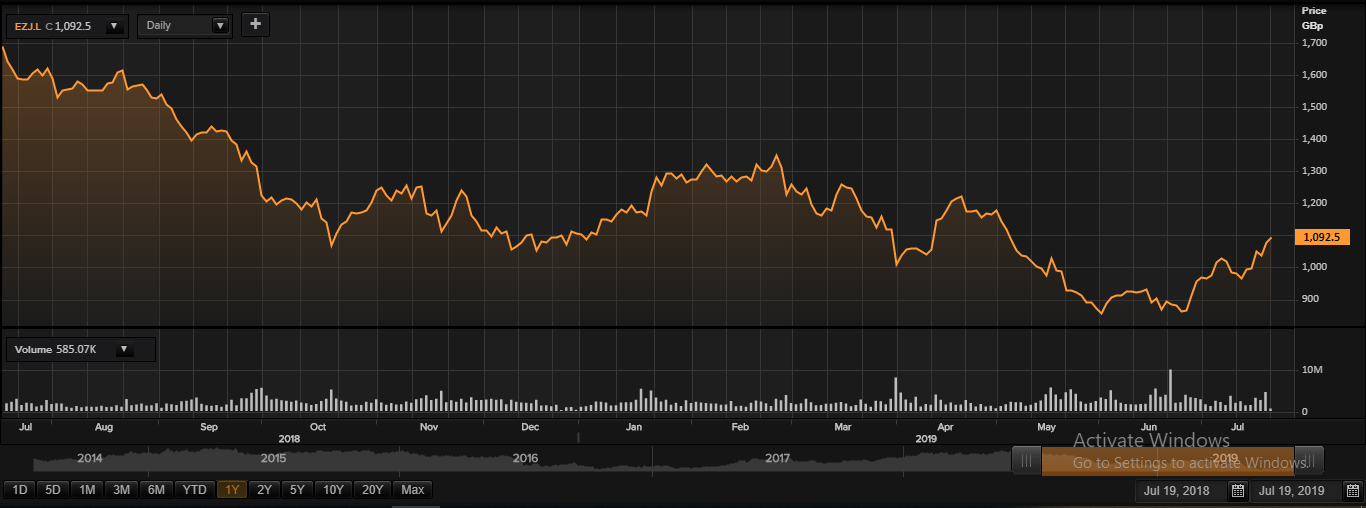
Daily Chart as at July-19-19, before the market close (Source: Thomson Reuters)
Â
On July 19, 2019, at the time of writing (before the market close, GMT 09:07 AM), EasyJet PLC shares were trading at GBX 1,092.50, up by 1.53 per cent against the previous day closing price. Stock's 52 weeks High and Low is GBX 1,712.00 /GBX 840.00.
Â
Thomas Cook Group Plc
Thomas Cook Group PLC (TCG) is a UK based travel company. The company is amongst the top travel companies worldwide and is having operations in 16 countries. The company owns 105 aircraft, 200 hotels and resorts and is having an employee base of 21,000 professionals catering to the needs of 22 million customers. Its shares are listed on the main market of the London Stock Exchange and a constituent of FTSE Small-Cap index.
Financial Performance for H1 FY19
In the first half of the financial year 2019 ending 31st March 2019, the company's reported revenue was £3,019 million against £3,227 million in H1 2018. The revenue declined by £208 million due to the impact of currency movements and changes to IFRS 15. The underlying Gross profit stood at £599 million in H1 FY2019 versus £672 million in H1 FY2018 and underlying gross margin for the period was 19.8 per cent. The underlying EBIT loss was up by £76 million (£65 million on Like-for-like basis) to £245 million in H1 FY2019 from a loss of £170 million in H1 FY2018. The loss from operations stood at £1,386 million in H1 FY2019 versus a loss of £215 million in H1 FY2018. Loss before tax for H1 FY2019 increased by £1,153 million to £1,456 million from a loss of £303 million in H1 FY2018. In H1 FY2019, the company paid tax expenses of £18 million against tax rebate of £48 million in H1 FY2018. The loss for the period for H1 FY2019 increased by £1,219 million from a loss of £255 million in H1 FY2018 to a loss of £1,474 million in H1 FY19. The net debt was up by £361 million to £1,247 million in H1 FY2019 from £886 million in H1 FY2018.
Share price performance
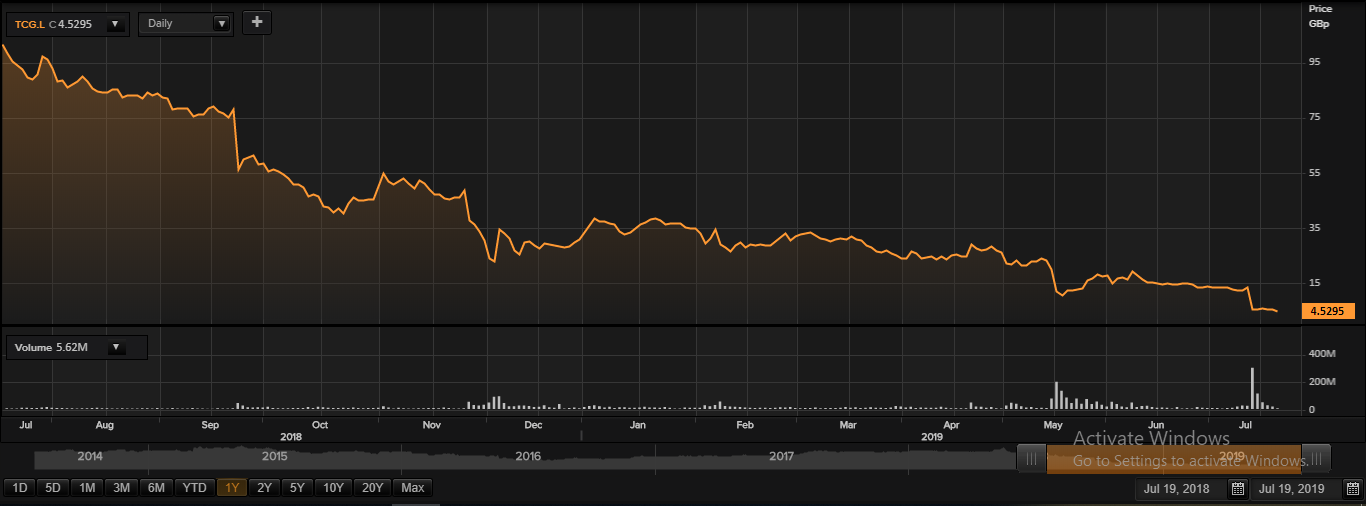
Daily Chart as at July-19-19, before the market close (Source: Thomson Reuters)
On July 19, 2019, at the time of writing (before the market close, GMT 09:14 AM), Thomas Cook Group shares were trading at GBX 4.52, down by 10.84 per cent against the previous day closing price. Stock's 52 weeks High and Low is GBX 102.73 /GBX 4.29.
SSE PLC
SSE plc (SSE) is into the energy sector. It has distribution networks for both gas and electricity in both retail and wholesale segments. It provides energy related services to homes and businesses.
Trading update Q1 FY20
The companyâs outlook for the current year remains unchanged, although the forecasted renewable energy output has been lowered in Q1. The company intends to declare an annual dividend of 80 pence per share for FY20, which is in line with the management expectations.
Financial highlights for FY19
The companyâs reported PBT (profit before tax) stood at £1,370.6 million in FY19, which was up by 59 per cent from the previous year. The companyâs adjusted PBT (profit before tax) stood at £725.7 million, which was down by 38 per cent from the previous year. The companyâs reported EPS (earnings per share) stood at 135.2 pence per share, which was up by 110 per cent from the previous year. The companyâs adjusted EPS (earnings per share) stood at 67.1 pence per share, which was down by 32 per cent from the previous year.
Share price performance
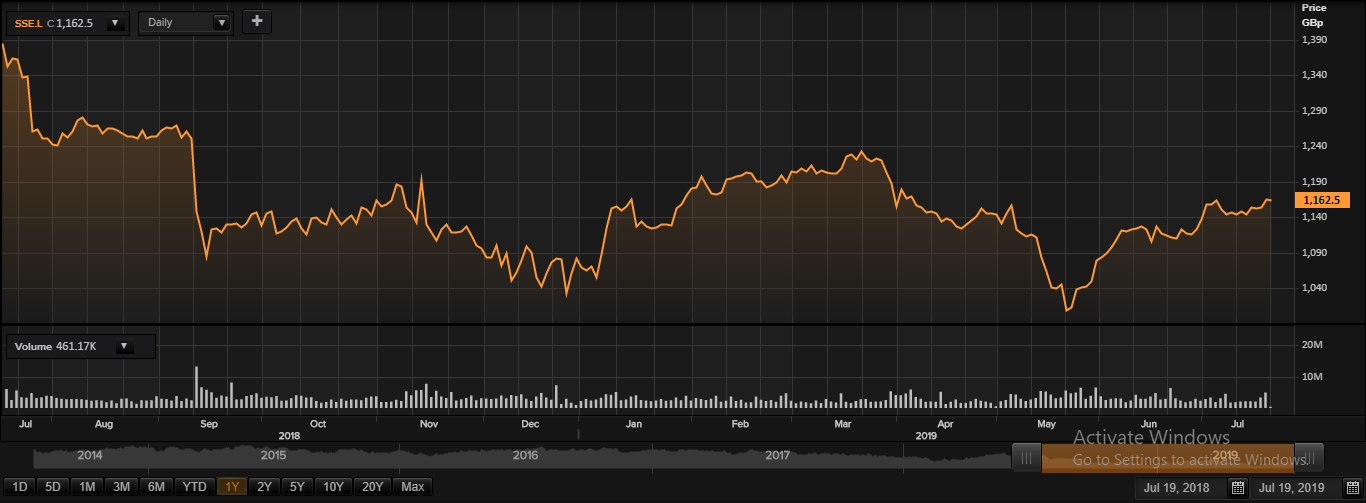
Daily Chart as at July-19-19, before the market close (Source: Thomson Reuters)
On July 19, 2019, at the time of writing (before the market close, GMT 09:18 AM), SSE shares were trading at GBX 1,162.5, down by 0.12 per cent against the previous day closing price. Stock's 52 weeks High and Low is GBX 1,371.00/GBX 997.80.
