


eve Sleep PLC
eve Sleep PLC (EVE) is a company which operates in e-commerce space. It is into designing and trading of sleep mattresses and other related products. Itâs business model is similar to that of Business-to-Consumer (B2C) model.
Recent News
On July 18, 2019, the company released its Pre-close trading update for H1 FY19. The companyâs underlying revenue stood at £12.9 million in H1 FY19 (down by 8 per cent) as against £14.1 million in H1 FY18. In line with the board expectations, the company was successful in halving EBITDA losses for H1FY19 as against the previous year. The EBITDA loss stood at £5.9 million in H1 FY19 as against the loss of £11.9 million in H1 FY18. This improvement by the company can be attributed to refocus on marketing strategy and optimising overheads. The companyâs net cash stood at £12.5 million by the end of H1 FY19. The company entered into new partnerships with Argos, Dunelm and Homebase to make it products available at a greater number of places for customers to experience and purchase eve products and making them aware of the brand.
Financial Highlights for FY18
The companyâs revenue stood at £34.8 million (up by 25 per cent) in FY18 as against £27.7 million in FY17. The company did well in core markets. The companyâs revenue (core markets) stood at £29.4 million (up by 35 per cent) in FY18 as against £21.7 million in FY17. The companyâs gross profit margin (core markets) stood at 52.7 per cent in FY18 as against 58.2 per cent in FY17.
Share price performance
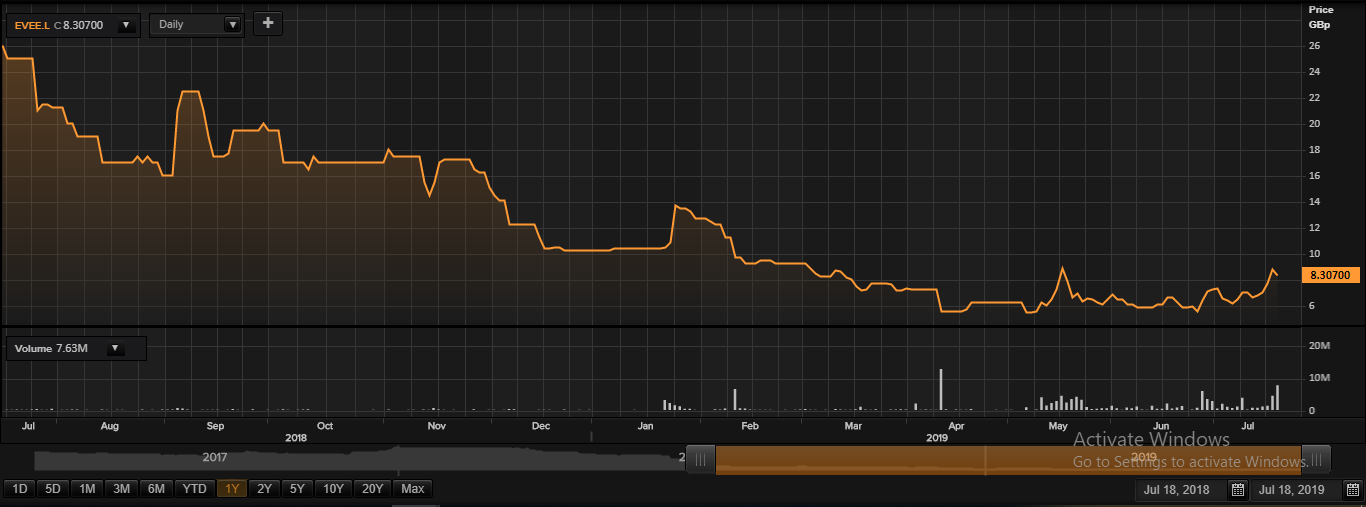
Daily Chart as at July-18-19, before the market close (Source: Thomson Reuters)
On July 18, 2019, at the time of writing (before the market close, at 11:34 AM GMT), EVE shares were trading at GBX 8.30, down by 5.68 per cent against the previous day closing price. Stock's 52 weeks High and Low are GBX 26.00 /GBX 5.10. At the time of writing, the share was trading 68.07 per cent lower than the 52w High and 62.74 per cent higher than the 52w low. Stockâs average traded volume for 5 days was 1,623,883.20; 30 days â 1,309,276.57 and 90 days â 1,018,330.23. The average traded volume for 5 days was up by 24.03 per cent as compared to 30 days average traded volume. The companyâs stock beta was 0.70, reflecting lower volatility as compared to the benchmark index. The outstanding market capitalisation was around £22.85 million.
Hilton Food Group PLC
Hilton Food Group plc (HFG) is one of the leading specialist meatpacking companies. It was formed in the year 1994 and established a lamb and beef central meat packing facility in England. The company manufactures a range of products, including roasting joints, steaks, rashers, and sausages. The group supplies products to key global food retailers including the Albert Heijn, Tesco, ICA, Ahold, Coop Denmark and Rimi. The company has operations across Western and Central Europe, including countries such as the UK, the Netherlands, Sweden, Ireland, Denmark, Portugal, New Zealand, and Australia.
Trading update for the period of 6 months ending July 14th, 2019
The group continues to do well as expected by the board. The companyâ performance in Western Europe was good across various markets. The groupâs performance in the UK was impressive. The revenues continued to surge due to the Seachill fish business. However, the companyâs business in Holland was not so good as compared to the previous year, though the Dalco vegetarian business has been doing well.
The company performed as per the management expectations in Central Europe with inception of the new Fresh Food facility. Similarly, in Australia, the company was able to achieve two-digit growth in H1. The company maintains sound financial health, supporting current as well as future growth.
Financial Highlights for FY18
For FY18, revenue from operations surged by 21.5% to £1.6 billion (21.9% on a constant currency basis), volume grew by 13.5 per cent. Reported Operating profit rose from £35.1 million in 2017 to £46.3 million in 2018. The profit for the year climbed by 28.35% to £34.7 million against the £27 million in FY17. Basic earnings per share attributable to common shareholders increased by 20.18% to 39.9 pence as compared with 33.2 pence reported last year. The Hilton Plc is foraying into new geographies and markets either with its existing partners or with new customers. EBITDA surged by 18.9% to £70.7 million as compared with £59.5 million in previous year (excluding extraordinary acquisition expenses). Net finance cost rose to £2.9 million as compared with £0.9 million during FY17, indicating higher debt borrowed for acquisition at Seachill and increased investment in their other facilities as well. Dividend per share rose by 12.6% to 21.4 pence as compared with a dividend of 19.0 pence per share reported during FY17.
Share price performance
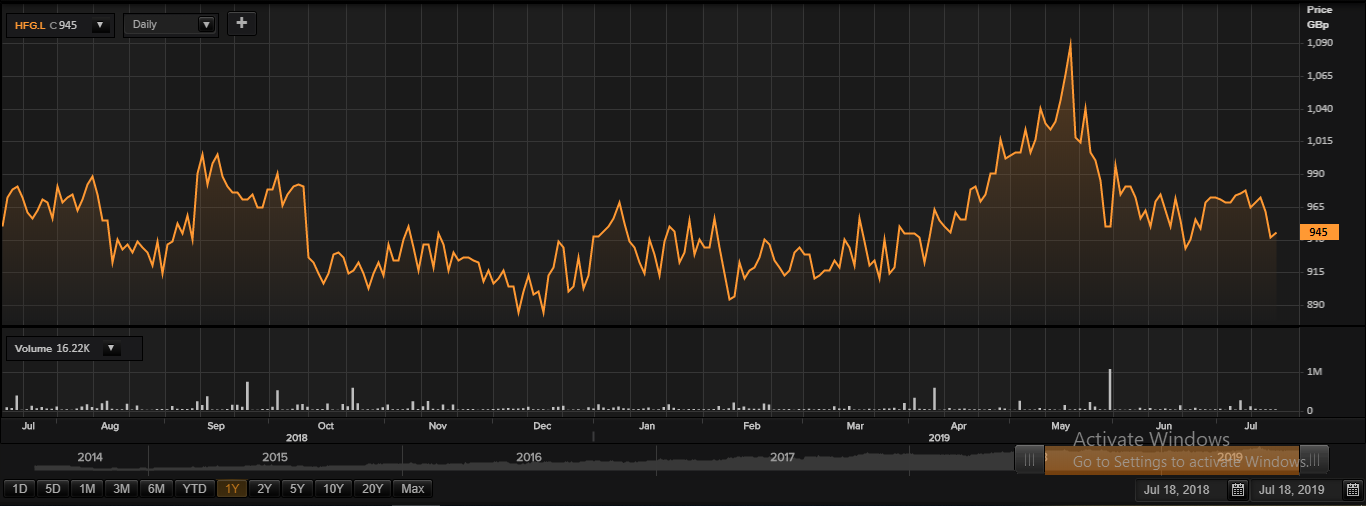
Daily Chart as at July-18-19, before the market close (Source: Thomson Reuters)
On July 18, 2019, at the time of writing (before the market close, at 11:57 AM GMT), HFG shares were trading at GBX 945, up by 0.42 per cent against the previous day closing price. Stock's 52 weeks High and Low are GBX 1,096.00 /GBX 880.00. At the time of writing, the share was trading 13.77 per cent lower than the 52w High and 7.38 per cent higher than the 52w low. Stockâs average traded volume for 5 days was 37,841.40; 30 days â 38,644.80 and 90 days â 59,096.79. The average traded volume for 5 days was down by 2.08 per cent as compared to 30 days average traded volume. The companyâs stock beta was 0.62, reflecting lower volatility as compared to the benchmark index. The outstanding market capitalisation was around £767.09 million, with a dividend yield of 2.27 per cent.
Scientific Digital Imaging PLC
Scientific Digital Imaging Plc (SDI) is into designing and manufacturing of equipment which are widely used in life sciences, healthcare, astronomy, consumer manufacturing and art conservation. The company manufactures light imaging cameras, infrared imaging system, water purification products and vacuum ovens.
Trading update for the year ended 30 April 2019 (revised)
The board expects the revenues to be near around £17.4 million for the full year as against £14.5 million in FY18. Similarly, the Adjusted PBT (before amortisation, dividends, and acquiring costs) is not expected to be less than £2.9 million as expected by the management. The companyâs PBT should be nearly £2.0 million as against £1.7 million in FY18.
Financial Highlights for FY19
The companyâs revenue stood at £17.4 million (surged by 20 per cent) in FY19 as against £14.5 million in FY18. The gross margin of the company plunged to 66.1 per cent this year as against 65.8 per cent in FY18. The companyâs adjusted PBT (Profit before tax) stood at £3.0 million (up by 32 per cent) this year as against £2.3 million in FY18. The companyâs PBT (Profit before tax) stood at £2.1 million (up by 24 per cent) this year as against £1.7 million in FY18. The companyâs cash from operations stood at £3.6 million (up by 28 per cent) this year as against £2.9 million in FY18. The company has a net debt of approximately £1.6 million as on April 30, 2019.
Share price performance
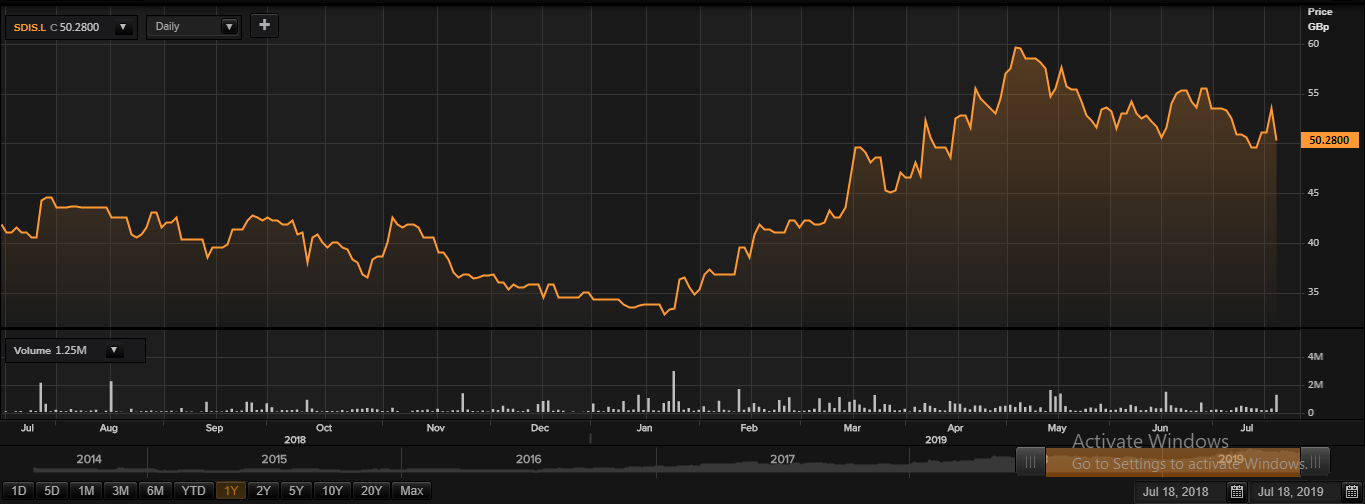
Daily Chart as at July-18-19, before the market close (Source: Thomson Reuters)
On July 18, 2019, at the time of writing (before the market close, at 12:57 PM GMT), SDI shares were trading at GBX 50.28, down by 6.01 per cent against the previous day closing price. Stock's 52 weeks High and Low are GBX 61.50/GBX 32.00. At the time of writing, the share was trading 18.24 per cent lower than the 52w High and 57.12 per cent higher than the 52w low. Stockâs average traded volume for 5 days was 215,997.20; 30 days â 292,155.40 and 90 days â 376,355.13. The average traded volume for 5 days was down by 26.07 per cent as compared to 30 days average traded volume. The companyâs stock beta was 0.89, reflecting lower volatility as compared to the benchmark index. The outstanding market capitalisation was around £51.89 million.
SRT Marine Systems PLC
SRT Marine Systems plc (SRT) develops and supplies marine technology. It develops an automatic identification system (AIS)-based marine technologies, and related products for applications in marine technologies used in fisheries management for safety and security and environment protection.
Financial Highlights for FY19
The companyâs revenue stood at £20.6 million (up by 286 per cent) in FY19 as against £5.3 million in FY18. The companyâs Gross profit margin stood at 45 per cent this year as against 43 per cent in FY18. The companyâs PBT (Profit before tax) stood at £3.2 million this year as against loss before tax of £4.2 million in FY18. The companyâs cash stood at £3.9 million.
Share price performance
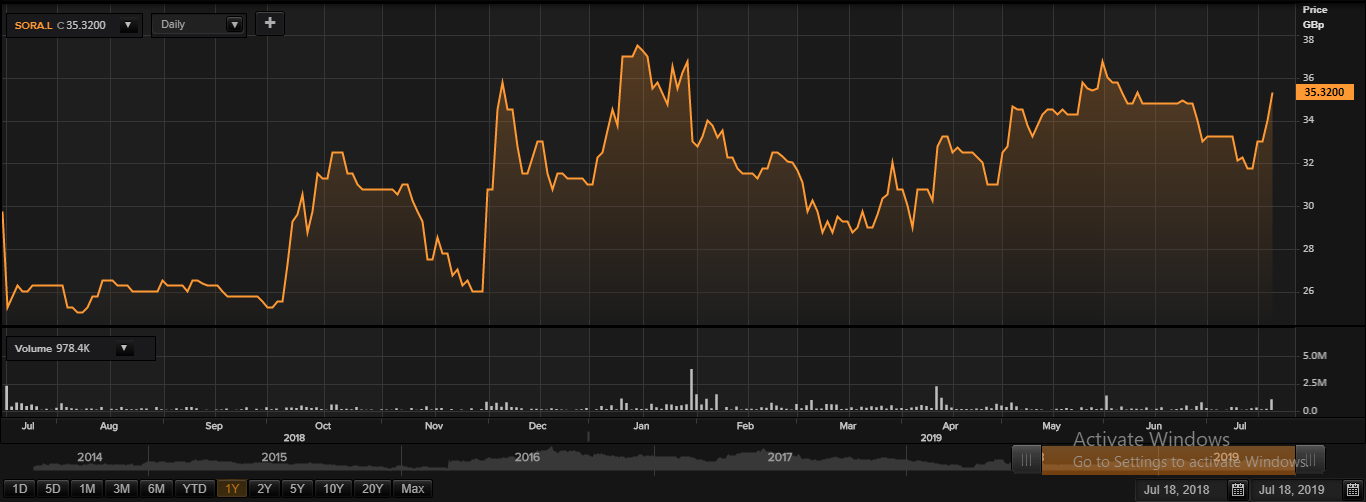
Daily Chart as at July-18-19, before the market close (Source: Thomson Reuters)
On July 18, 2019, at the time of writing (before the market close, at 02:04 PM GMT), SRT shares were trading at GBX 35.32, up by 3.88 per cent against the previous day closing price. Stock's 52 weeks High and Low are GBX 38.00/GBX 20.55. At the time of writing, the share was trading 7.05 per cent lower than the 52w High and 71.87 per cent higher than the 52w low. Stockâs average traded volume for 5 days was 129,394.20; 30 days â 153,656.23 and 90 days â 238,426.00. The average traded volume for 5 days was down by 15.79 per cent as compared to 30 days average traded volume. The companyâs stock beta was 0.78, reflecting lower volatility as compared to the benchmark index.
