


Grafton Group Plc
Grafton Group Plc (GFTU) is a Dublin, Ireland based support services company that is engaged in the business of distributorship of building materials to contractors and home builders involved in the repair, maintenance and building of new houses, across the world. The company has three major operating segments which are Merchanting, Retailing and Manufacturing. Across all these three business segments, the company operates under the pretext of various brands such as Buildbase, Chadwicks, Euromix, Selco, Leyland and a host of various other brands.
GFTU Trading Update
On 17th October 2019, the company made a press release to announce the trading update for the third quarter of 2019. This update was released ahead of the planned 12th November 2019 updates. The company reported that the Like for like Group revenue in continuing operations was up by 0.9 per cent and the total revenue was up by 4.5 per cent Q3 2019. The company also highlighted that it anticipated announcing an FY 2019 operating profit from continuing operations in between 4 per cent to 8 per cent, lower than the market estimates.
GFTU Stock Price Performance
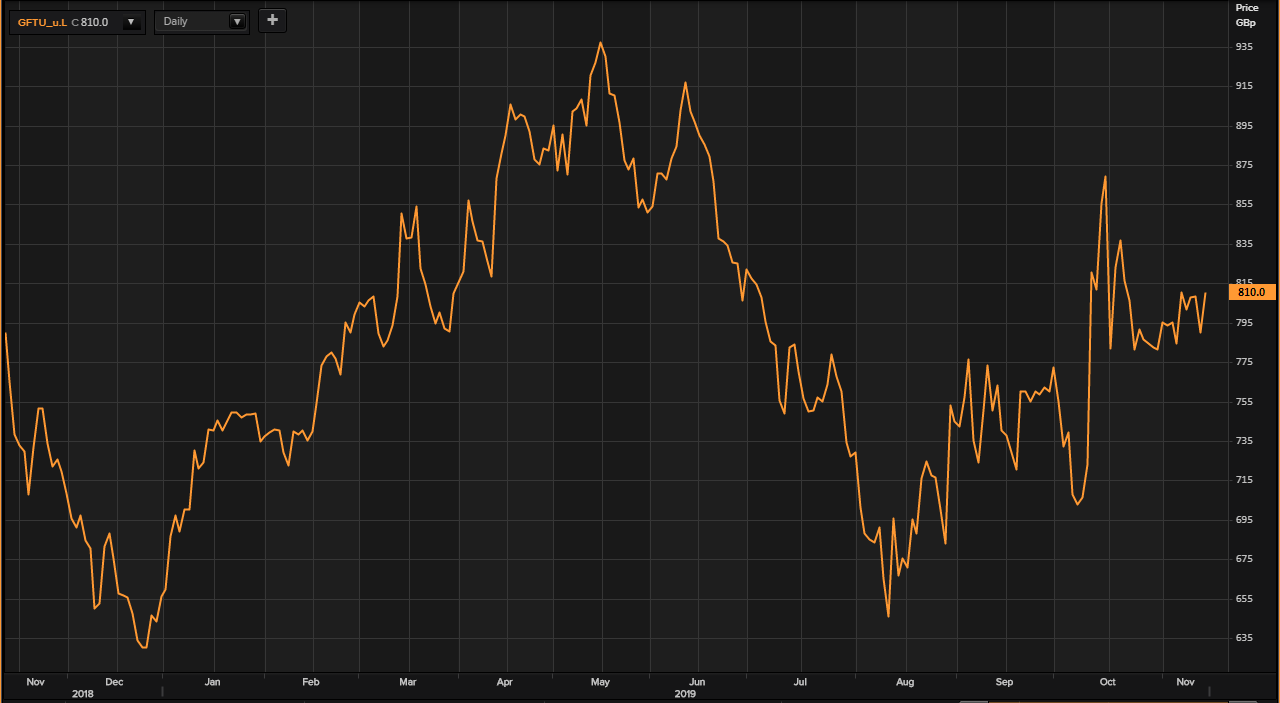
Source: Thomson Reuters
On 14th November 2019, at 09:50 A.M GMT, at the time of writing, Grafton Group Plcâs stock price has been reported to be trading at GBX 810.00 per stock, an increase of 2.53 per cent or GBX 20.00 per stock as compared to the previous dayâs closing price, which has been reported at GBX 790.00 per stock. The reported Market Capitalisation of Grafton Group Plc has been at GBP 1.878 billion.
The beta of the Grafton Group Plcâs stock has been reported to be at 0.51. This means that the companyâs stock price movement is less volatile in its trend, as compared to the benchmark market indexâs movement.
Bovis Homes Group Plc
Bovis Homes Group Plc (BVS) is a West Malling, the United Kingdom based home development and house building company. The company offers a wide arrangement of properties, including one room condos, two-room lofts, five-room condos and six room separated family homes. The Company does and deals with a scope of lodging improvement exercises too, including obtaining of the land, working of the houses and the after-care administration for its clients.
BVS Financial Performance
On 10th September 2019, the company reported its half-year results for the six months ended 30th June 2019. The company reported that they achieved record-high profits as PBT (profit before tax) was up by 20 per cent year on year to £72.4 million. The company reported a 4 per cent year on year increase in total completions to 1,647 in H1 2019. The company reported Earnings per share to be up by 21 per cent year on year to GBX 43.7 per share in during the reporting period.
BVS Stock Price Performance
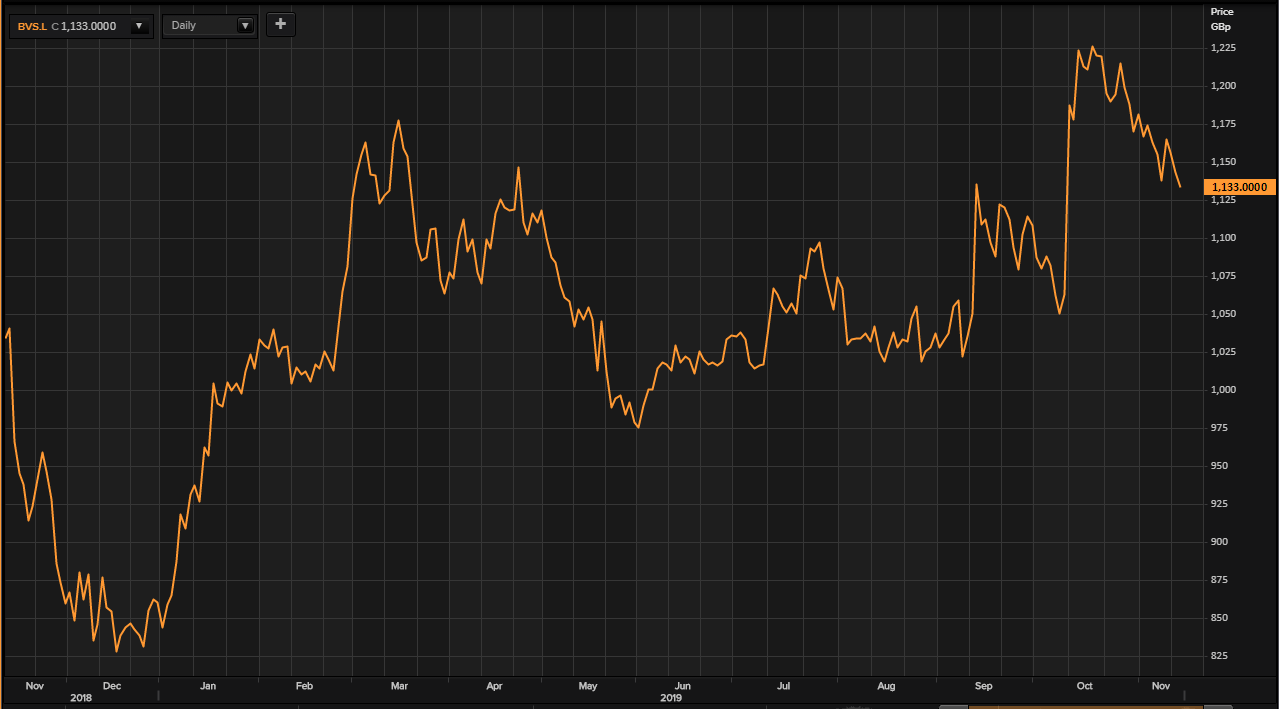
Source: Thomson Reuters
On 14th November 2019, at 09:40 A.M GMT, at the time of writing, Bovis Homes Group Plcâs stock price has been reported to be trading at GBX 1133.00 per stock, a decrease of 0.87 per cent or GBX 10.00 per stock as compared to the previous dayâs closing price, which has been reported at GBX 1143.00 per stock. The reported Market Capitalisation of Bovis Homes Group Plc has been at GBP 1.695 billion.
The beta of the Bovis Homes Group Plcâs stock has been reported to be at 0.89. This means that the companyâs stock price movement is less volatile in its trend, as compared to the benchmark market indexâs movement.
Stobart Group Limited
Stobart Group Limited (STOB) is a Guernsey based infrastructure and support services organization. It works worldwide over railroad support, biomass vitality, and aviation areas other than keeping up interests in the supply chain portfolio and national property. The aviation division also looks for Carlisle Lake District Airport and London Southend Airport. It also performs sourcing and preparation of fuel to biomass plants through long haul contracts.
STOB Financial Performance
On 14th November 2019, the company announced its interim results for the six months ended 31st August 2019. The company reported that the Group revenue was up by 34.1 per cent to £93.1 million, majorly because of a robust performance by Stobart Energy division. The company also reported that the Underlying EBITDA was up significantly by 187.1 per cent year on year to £12.1 million though the loss for the period had also increased to £20.9 million.
STOB Stock Price Performance
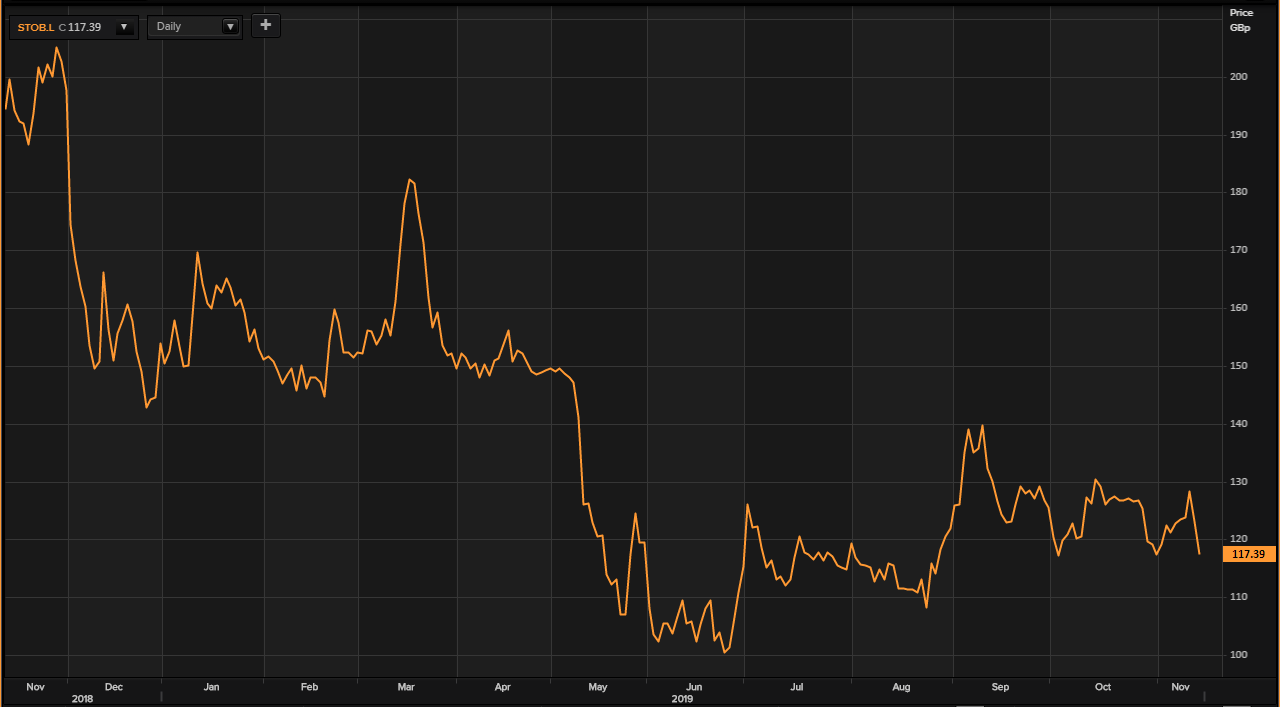
Source: Thomson Reuters
On 14th November 2019, at 09:30 A.M GMT, at the time of writing, Stobart Group Limitedâs stock price has been reported to be trading at GBX 117.39 per stock, a decrease of 4.56 per cent or GBX 5.61 per stock as compared to the previous dayâs closing price, which has been reported at GBX 123.00 per stock. The reported Market Capitalisation of Stobart Group Limited has been at GBP 460.82 million.
The beta of the Stobart Group Limitedâs stock has been reported to be at 1.33. This means that the companyâs stock price movement is more volatile in its trend, as compared to the benchmark market indexâs movement.
Card Factory Plc
Card Factory Plc (CARD) is a Wakefield; the United Kingdom based General retailing company that specialises in the retailing of greeting cards. Card Factory focuses more on mid-market segments and value to the UK's enormous and versatile welcome cards events. Card Factory's crucial to assist clients with praising their life minutes by giving a scope of value cards, wrap, dressings, party and gifting items at esteem costs. The Group primarily works across the nation through a chain of more than 950 Card Factory stores, just as through its transactional websites which are the likes of www.cardfactory.co.uk as well as www.gettingpersonal.co.uk.
CARD Trading Statement
On 14th November 2019, the company announced a trading statement for the third quarter of the year. The company reported a Year to 31st October 2019 (Year to date) revenue increase of 5.0 per cent, which was at 3.4 per cent during the same period the previous year. The company also highlighted that the Overall YTD Card Factory like for like sales moved up by 0.9 per cent during the period.
CARD Stock Price Performance
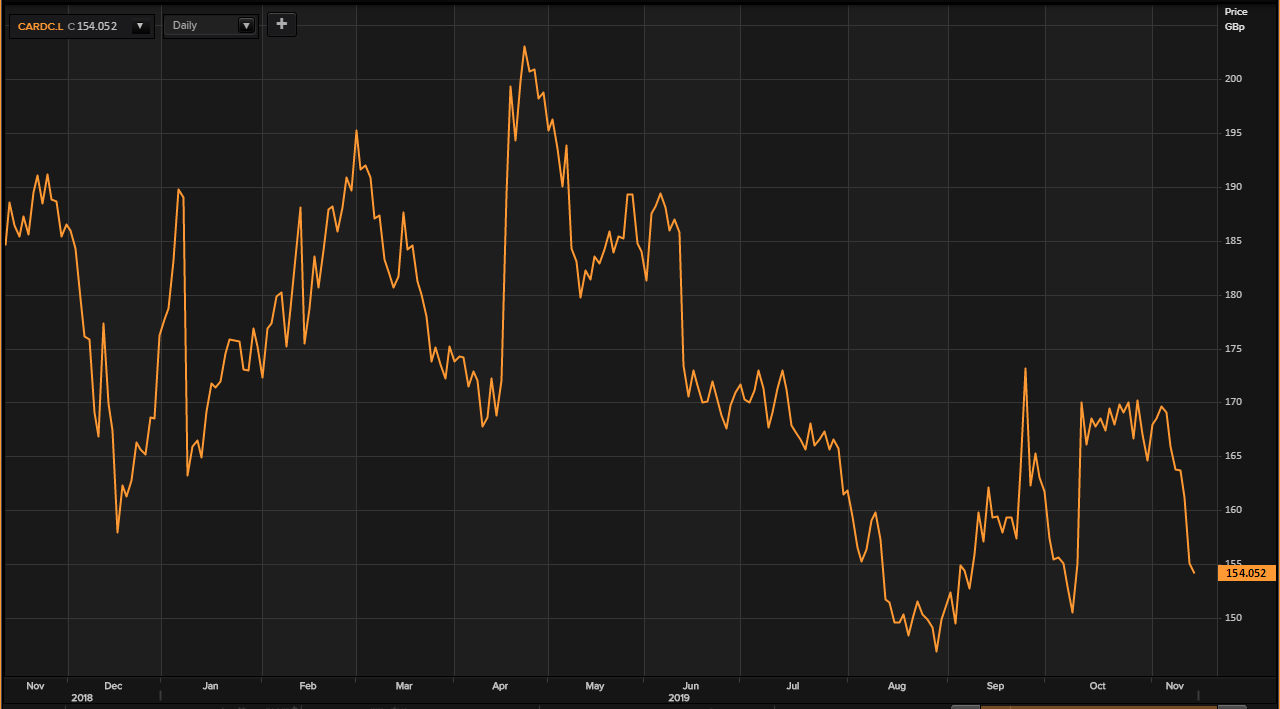
Source: Thomson Reuters
On 14th November 2019, at 09:18 A.M GMT, at the time of writing, Card Factory Plcâs stock price has been reported to be trading at GBX 154.05 per stock, a decrease of 0.61 per cent or GBX 0.948 per stock as compared to the previous dayâs closing price, which has been reported at GBX 155.00 per stock. The reported Market Capitalisation of Card Factory Plc has been at GBP 529.40 million.
The beta of the Card Factory Plcâs stock has been reported to be at 0.92. This means that the companyâs stock price movement is slightly less volatile in its trend, as compared to the benchmark market indexâs movement.
Mediclinic International Plc
Mediclinic International Plc (MDC) is a worldwide private healthcare services organization. The organization was established in the year 1983 and is headquartered in Stellenbosch, South Africa. The organization works globally with Switzerland, Namibia, South Africa and the United Arab Emirates being the principal markets. Intense care, master orientated, multi-disciplinary human services administrations are the significant assistance contributions of the organization.
MDC Financial Performance
On 14th November 2019, the company announced its half-year results for the six months ended 30th September 2019. The company reported that the revenue increased by around 9 per cent (Pre-IFRS 16) to £1515 million, an increase of 6 per cent in constant currency, majorly driven by a robust performance across in all the three divisions. The company also reported that the Adjusted earnings per share were almost flatlined at GBX 10.3 per share. The company improved cash conversion at 98 per cent of the adjusted EBITDA compared to just 69 per cent in H1 2019.
| Â | IFRS 16 1H20 | Pre-IFRS 16 1H20 | Pre-IFRS 16 1H19 | Pre-IFRS 16 |
| £'m | £'m | £'m | % variance5 | |
| Revenue1 | 1 515 | 1 515 | 1 390 | 9% |
| EBITDA2 | Â 252 | Â 222 | Â 213 | 4% |
| Adjusted EBITDA2 | Â 252 | Â 222 | Â 213 | 4% |
| Operating profit | Â 149 | Â 142 | Â 39 | 264% |
| Adjusted operating profit2 | Â 144 | Â 137 | Â 137 | 0% |
| Earnings / (loss)3 | Â 109 | Â 112 | Â (168) | 167% |
| Adjusted earnings2&3 | Â 73 | Â 76 | Â 76 | 0% |
| Earnings / (loss) per share (pence) | 14.8 | 15.2 | -22.8 | 167% |
| Adjusted earnings per share (pence)2 | 9.9 | 10.3 | 10.3 | 0% |
| Interim dividend per share (pence) | 3.2 | 3.2 | 3.2 | 0% |
| Net debt4 | 1775 | 1775 | 1717 | 3% |
| Cash conversion | 98% | 98% | 69% |
Source: Company Website
MDC Stock Price Performance
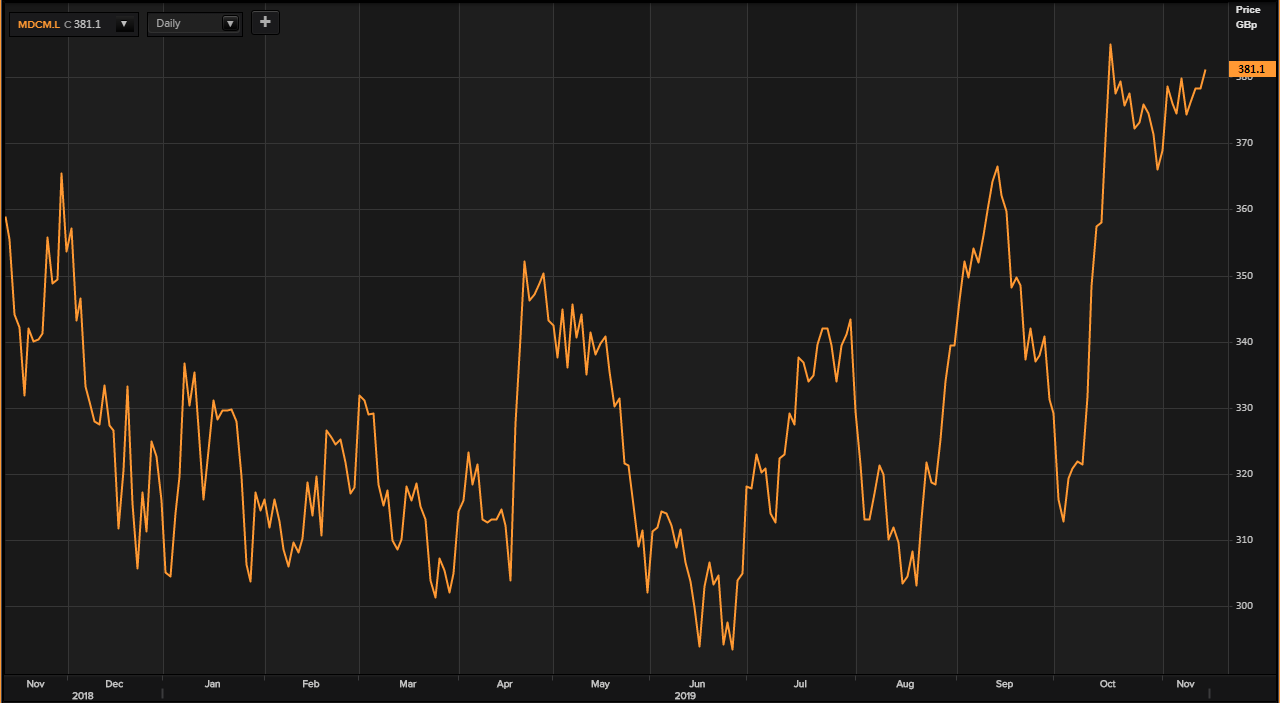
Source: Thomson Reuters
On 14th November 2019, at 09:08 A.M GMT, at the time of writing, Mediclinic International Plcâs stock price has been reported to be trading at GBX 381.1, an increase of 0.77 per cent or GBX 2.90 per stock as compared to the previous dayâs closing price, which has been reported at GBX 378.20 per stock. The reported Market Capitalisation of Mediclinic International Plc has been at GBP 2.788 billion.
The beta of the Mediclinic International Plcâs stock has been reported to be at 1.30. This means that the companyâs stock price movement is more volatile in its trend, as compared to the benchmark market indexâs movement.
