


Overview
Burberry Group Plc (LSE:BRBY) is located in United Kingdom and is a manufacturer, retailer, wholesaler and seller of luxury goods. The company is into marketing and selling of accessories, men's and women's apparels, children wear, beauty and other products. In addition to this, the company offers leather goods, watches, sunglasses, beauty products and handbags.
The company sells its products via an expanded network of retail, licensing and wholesale channels globally and maintain its operations through concessions store, digital commerce platforms, multi-brand speciality account stores, outlets, mainline stores, franchisees and department stores.
As per the latest data available, the number of retail stores of the company stood at 230, while it had 147 concessions, 51 outlets and 44 franchise stores too. Its shares are listed on the London Stock Exchange, and the company has issued Level 1 ADR to enable American investors to subscribe to Burberry's shares. Burberry Group Plc was formed in the year 1856.
Trading Update Q1 FY2020
On 16th July 2019, the Burberry Group Plc released its trading update for Q1 FY2020. The company had a strong response to its Riccardo Tisci's product from consumers as expected by the management. The new collection delivered a robust growth as against previous year collections. The new product proportion offer surged by 50 per cent (approx.) in stores. The company improved its brand name through press coverage, an endorsement from influencers and social media traction and shifted consumer perceptions.
For the first quarter of the financial year 2020, the companyâs revenue increased by 4 per cent (reported basis) to £498 million from £479 million in the first quarter of the financial year 2019. The revenue surged by 2 per cent on the CER (constant exchange rate) basis. The companyâs Comparable store sales increased by 4 per cent in the Q1 FY2020 driven by strong demand for the new product.
The companyâs Asia Pacific business witnessed a high single-digit growth percentage due to an increase in sales from Mainland China. The companyâs EMEA business showed low single-digit growth driven by increased spending by tourists. The companyâs American business remained flat with contribution coming from the US with lower single-digit growth, and Canada was negatively impacted by an advanced markdown period.
The companyâs Men and Women apparel business showed a growth of double-digit percentage. The Accessories business had declined but was benefited from new styles. As a result of non-strategic store rationalisation programme, space declined by 2 per cent in the Q1 FY2020.
The companyâs guidance for the financial year 2020 had been maintained with stable revenues and operating margins on a CER basis.
Financial Highlights â Financial Year 2019 (£, million)

(Source: Annual Report, Company Website)
For the financial year ending 30 March 2019, the companyâs revenue from the continuing business was £2,720.2 million as against £2,732.80 million in the financial year 2018. At the reported rate, the revenue remained flat whereas based on CER (constant exchange rates), the revenue was up by 2 per cent, excluding the Beauty wholesale business. The companyâs wholesale and licensing revenue had increased for the financial year 2019. Based on the geographic segments, the revenue from EMEIA and the Asia Pacific had increased for the period. The product revenue had risen from Men, Women and Children apparels in the financial year 2019.
The reported gross profit declined by 2 per cent to £1,861 million in the financial year 2019 as against the financial year 2018 data of £1,897 million, while gross margin stood at 68.4 per cent in FY2019 versus 69.4 per cent in the FY2018.
The Adjusted operating profit in FY2019 decreased by 6 per cent to £438 million versus £467 million in FY2018, while remained flat at CER. The adjusted operating profit margin decreased to 16.1 per cent in FY2019 from 17.1 per cent in FY2018. The companyâs Reported operating profit surged by 7 per cent to £437.2 million in FY2019 from £410.3 million in FY2018.
The companyâs Adjusted PBT (profit before tax) stood at £443 million in FY2019 versus £471 million in FY2018, down by 6 per cent. Reported profit before taxation rose by 7 per cent to £441 million in FY2019 from £413 million in FY2018.
The companyâs profit for the year stood at £339.1 million in FY2019 versus £293.6 million in FY2018. The companyâs profit attributable to the owners of the company stood at £339.3 million in FY2019 against £293.5 million in FY2018.
The companyâs Adjusted basic earnings per share stood at 82.7 pence in FY2019 versus 82.8 pence in FY2018. The companyâs basic earnings per share stood at 82.3 pence in FY2019 versus 68.9 pence in FY2018. The Adjusted diluted Earnings Per Share remained flat at 82.1 pence for the Financial Year 2019. The companyâs diluted earnings per share stood at 81.7 pence in FY2019 versus 68.4 pence in FY2018.
The companyâs Full year dividend increased by 3 per cent to 42.5 pence per share against the 41.3 pence per share in FY18. The interim dividend remained flat at 11 pence in the financial year 2019.
The companyâs net cash for the Financial year 2019 stood at £837 million as against £892 million in the Financial year 2018. The companyâs Net Debt (Lease Adjusted) was at £409 million in FY2019 versus £327 million in FY2018.
The companyâs Capital expenditure for the FY2019 stood at £110 million versus £106 million in FY2018. For the financial year 2019, the companyâs FCF (Free cash flow) stood at £301 million versus £484 million in FY2018.
Key Risks
Unethical behaviour, unfavourable incidents or erroneous media coverage relating to the companyâs senior executives, products, practices or supply chain operations could damage the company's reputation.
International Chinese consumer spending patterns significantly change, having an immediate adverse impact on company sales. Volatility in foreign exchange rates could have a material impact on the companyâs reported results.
The success of the business over the long term will depend on the social and environmental sustainability of the operations, the resilience of the supply chain and the ability to manage the impact of any potential climate change on the business model and performance.
 The company operates in a wide range of markets and is exposed to the changing economic, social, regulatory, and political developments that may affect customer demand, disrupt its operations and impact profitability.
Burberry Group Plc Share Price Performance
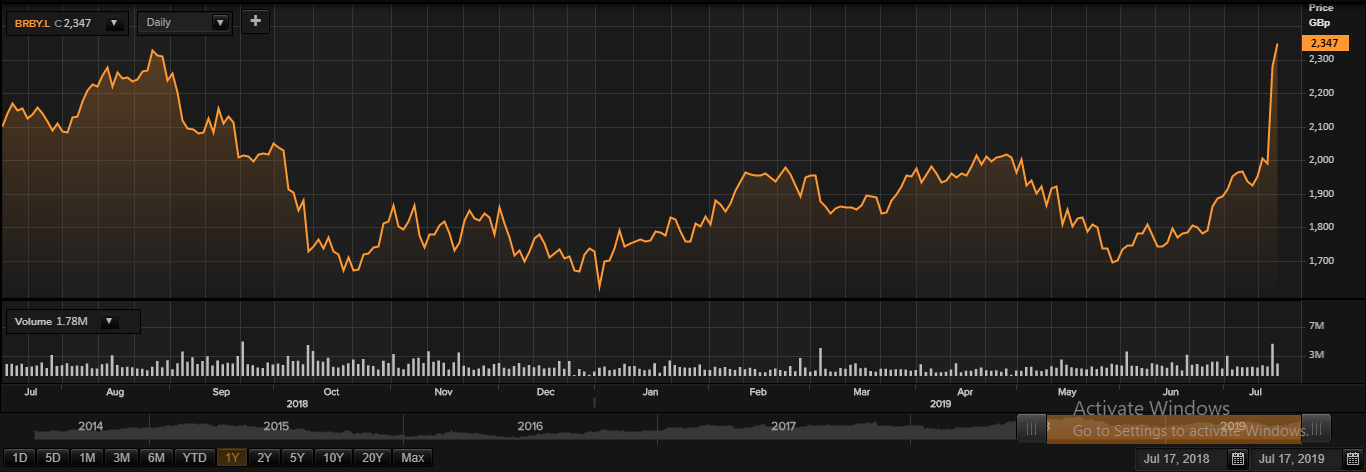
Daily Chart as at July-17-19, before the market closed (Source: Thomson Reuters)
At the time of writing (as on July 17, 2019, at 4:25 PM GMT), shares of Burberry Group Plc were quoting at GBX 2,347/share and added 3.07 per cent against the yesterday's closing price level. The companyâs outstanding market capitalisation stood around £9.45 billion, with a dividend yield of 1.87 per cent.
In the last 52-wks, shares of Burberry Group Plc have witnessed a high of GBX 2,362.00 (as on Jul 17, 2019) and a low of GBX 1,618.50 (as on Jan 03, 2019). At the current trading level, as quoted in the price chart, its shares were trading 0.64 per cent below the 52wk high price level and 45.01 per cent above the 52wk low price level.
Today's volume in the stock (at the time of writing, before the market close) was at 1,853,708. However, the 5-day average daily volume traded in the stock stood at 2,003,939.60, which was 16.74 per cent lower against the average daily volume of 30 days traded on the LSE (London Stock Exchange).
From the SMA (Simple Moving Average) standpoint, at the time of writing, its shares were trading marginally above the 200-days SMA, 60-days SMA and 30-days SMA which indicates an optimistic trend in the stock price and carrying the potential to move up further from the current trading levels.
In the past 1 year, shares of the Burberry Group Plc have delivered a positive price return of 8.43 per cent. However, on a year-to-date basis, the stock was up by approximately 31.20 per cent and increased by 16.50 per cent in the past three months.
Share's RSI (Relative strength index) for the 9-days, 14-days and 30-days were hovering at an overbought range and stood at 89.07, 83.82 and 71.64 respectively. However, 3-days RSI of the stock was at 95.37.
The Financial Year 2019 results were soft as expected, and currently, Burberry navigates through a transition period into ânew Burberryâ under Riccardo Tisciâs (Chief Creative Officer) purview.
The group announced the FY20E guidance for broadly stable revenue and flat operating margin at constant FX with more credence towards the second half.
 The Financial Year 2020 is the final year of Burberryâs transition period managing the creative transition and rationalizing its distribution network (closing US wholesale non-luxury doors and closing 38 small retail stores in secondary locations) more in line with the new brand vision.
Capex should increase significantly to £200 million in FY20 versus £110 million in FY19, but further £150 million share buybacks confirmed for FY20. The company also announced additional cost savings in FY21-22 of around £135 million.
Amid all the headwinds faced by the company, revenue declined in the financial year 2019. The overseas markets also provide a challenging opportunity for the company.
