
 AUS
AUS
 NZ
NZ
 UK
UK
 CA
CA
 USA
USA
 IND
IND







Savannah Resources Plc bought Minority Interest in Mina do Barroso
Savannah Resources Plc (SAV) is based in the United Kingdom and is a multi-commodity and multi-geographic development company. The Company functions broadly in two primary segments namely, Oman Copper and Mozambique Mineral Sands. The Company is also evolving its gold and copper portfolio in Oman for commencing production. The Company is making progress in its Jangamo/Mutamba Heavy Mineral Sands Project in Mozambique. The Company possesses operational rights on three blocks spread across 1,270 square kilometres in the Semail Ophiolite belt in the Sultanate of Oman.
Â
Recent News
Savannah Resources recently assimilated 25 per cent Minority Interest in Mina do Barroso Project, which will increase its stake in the project to 100 per cent. This Project will play a crucial role in fortifying new (lithium) battery supply chain by providing a lasting and consistent source of battery grade. The company has appointed Whitman Howard Limited as âjoint brokerâ to the Company with immediate effect.
Financial Highlights for FY18 (£)
(Source: Annual report, Companyâs website)
Â
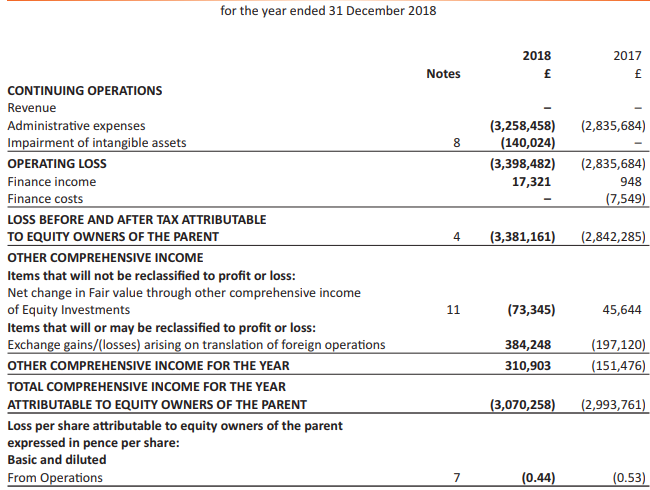
This can be expected with an active and expanding resource development group, the Group reported a loss of £3.4 million this year (2017: loss of £2.8 million). During the year, net assets have surged to £25.4 million (2017: £13.1 million) principally due to the rise in the exploration activity, the completion of the scoping study and the constant execution of the feasibility report in the Mina do Barroso lithium project, with add-ons in Exploration and evaluation assets in the lithium project of £6.1million, of which £2.0 million are payments of the contingent consideration milestones triggered during the year.
Another significant contribution to the net assets was the increase in the Cash and cash equivalents by £5.3 million as a result of well-bolstered equity fundraisings during the year, with a strong cash position at year-end of £7.7million. In April and July 2018, the Company raised a total of £14.7million cash (before expenses) by issuing (177,640,185) new ordinary shares at a significantly high average issue price of 8.25p per ordinary share (2017: 5.25p), representing a 57 per cent rise as against 2017 data. The Year 2019 is supposed to be another critical year for Savannah and if they can execute their plans across multiple project portfolios, the company could see significant changes in its size, status and, potentially, its value.
Share price performance
Daily Chart as at June-21-19, before the market close (Source: Thomson Reuters)
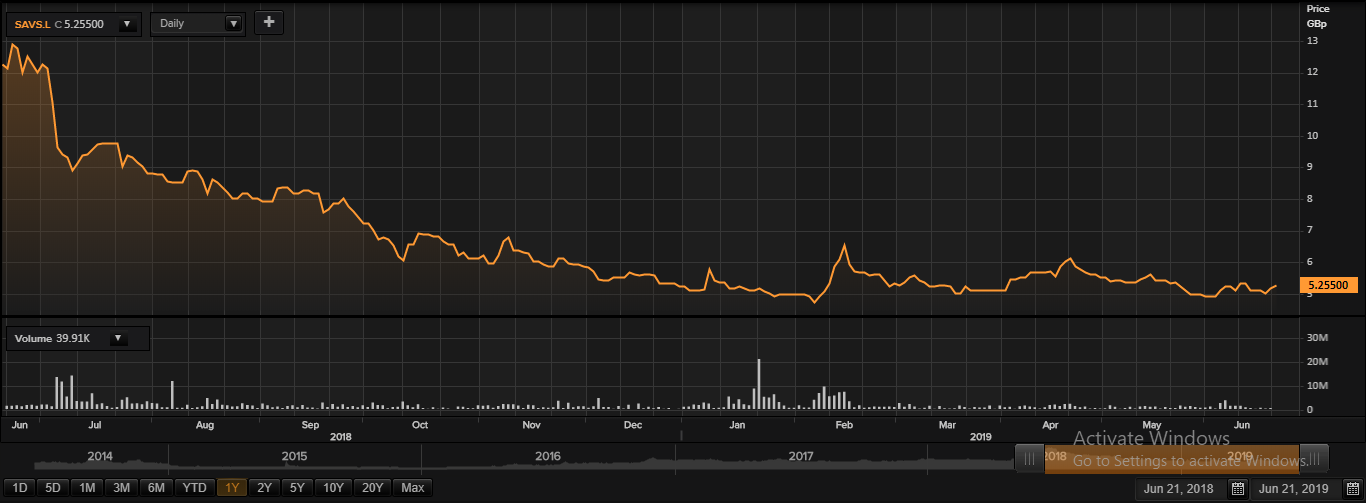
At the time of writing (as on June 21, 2019, at 01:37 PM GMT), shares of Savannah Resources were quoting at GBX 5.25 per share; up by 1.94 per cent against the yesterday's closing price level. The company had an outstanding market capitalisation of around £45.18 million.
In the last 52-weeks, shares of Savannah Resources have registered a high of GBX 13 (as on Jun 27, 2018) and a low of GBX 4.62 (as on Feb 07, 2019). At the current trading level, as quoted in the price chart, its shares were trading 59.61 per cent below the 52-week high price level and 13.63 per cent above the 52-week low price level.
The stockâs volume (before the market close, at the time of writing) stood at 39,909. Stock's average traded volume for 5 days was 361,945.00; 30 days- 902,405.33 and 90 days â 1,270,937.07. The average traded volume for 5 days was down by 59.89 per cent as compared to the 30 days average traded volume. The companyâs stock beta was 0.73, reflecting lower volatility as compared to the benchmark index.
The shares of the company (at the time of writing) were trading below the 60-days and 200-days SMA, which shows a negative trend in the stock price movement and could further move down from the current trading levels.
In the past 1 year, shares of Savannah Resources have delivered a negative price return of 57.96 per cent. On a year-to-date and three month basis, the stock was down by approximately 0.96 per cent respectively.
Share's RSI for the 30-days, 14-days and 9-days stood at 47.26, 48.54 and 51.06 respectively. Also, the stockâs 3-days RSI stood at 60.64.
Â
Tanfield Group Plc posted results for FY18
Tanfield Group Plc (TAN) is an investment company based in the United Kingdom, with two passive investments in Smith Electric Vehicles Corp. (Smith) and Snorkel International Holdings LLC (Snorkel).
Recent News
The company posted results for FY18 ending 31st December 2018.
Financial Highlights for FY18 (£, thousand)
(Source: Annual report, Companyâs website)
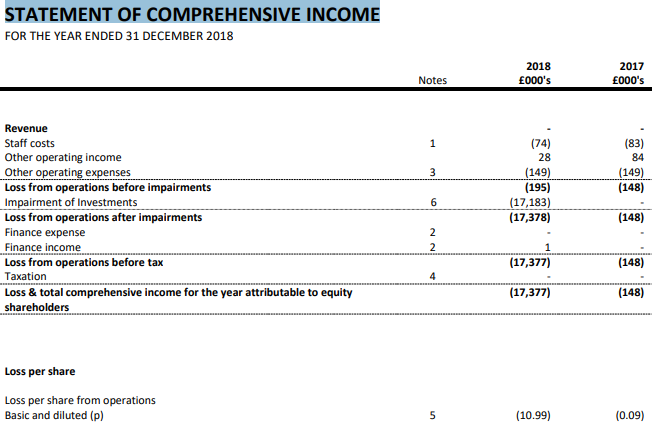
Turnover for the FY2018 was £nil (2017: £nil). The operating loss before impairments for this year stood at £195k as against £148k in FY17. Loss from operations after impairments stood at GBP 17.4 mn in FY2018. Total loss and comprehensive income attributable to common shareholders stood at (£17.4) million. Total assets at the end of the financial year 2018 stood at £19.3 million (2017: £36.4 million). No dividend has been paid or proposed for the year 2018 (2017: £nil). The loss of £17,377 thousand (2017: £148k) has been transferred to reserves.
In the financial year 2018, the basic and diluted loss per share recorded at 10.99 pence as compared to a loss of 0.09 pence per share in the financial year 2017. Net cash outflow from the operational activities accelerated to £197,000 against £135,000 recorded in the previous financial year 2017.
Tanfield Group Plc - Share price performance
 Â
Â
Daily Chart as at June-21-19, before the market close (Source: Thomson Reuters)
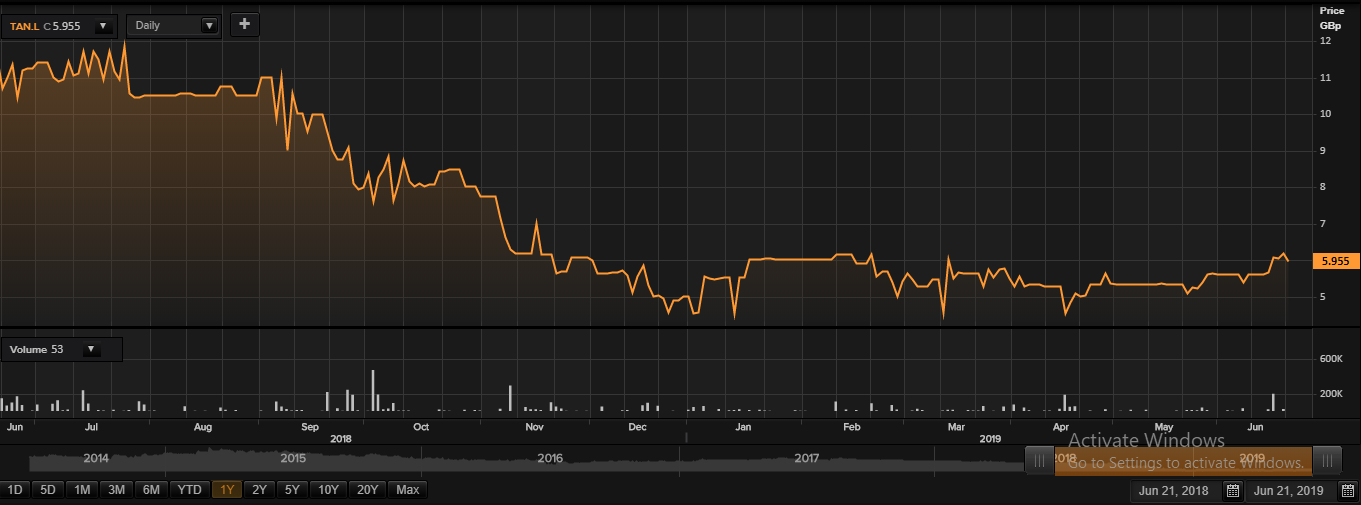
At the time of writing (as on June 21, 2019, at 02:41 PM GMT), shares of Tanfield Group Plc were quoting at GBX 5.955 per share; down by 3.64 per cent against the yesterday's closing price level. The company had an outstanding market capitalisation of £10.01 million.
In the last 52-weeks, shares of Tanfield Group Plc have registered a high of GBX 11.90 (as on Jul 10, 2018) and a low of GBX 4 (as on Apr 16, 2019). At the current trading level, as quoted in the price chart, its shares were trading 49.95 per cent below the 52-week high price level and 48.87 per cent above the 52-week low price level.
The stockâs volume (before the market close, at the time of writing) stood at 53. Stock's average traded volume for 5 days was 47,471.40; 30 days- 24,942.87 and 90 days â 23,460.92. The average traded volume for 5 days was up by 90.32 per cent as compared to the 30 days average traded volume. The companyâs stock beta was 0.94, reflecting slightly lower volatility as compared to the benchmark index.
The shares of the company (at the time of writing) were trading above the 30-days and 60-days SMA, which shows a positive trend in the stock price movement and could further move up from the current trading levels.
In the past 1 year, shares of Tanfield Group Plc have delivered a negative price return of 42.3 per cent. However, on a year-to-date basis, the stock was up by approximately 23.87 per cent and surged by 9.78 per cent in the past three months.
Share's RSI for the 30-days, 14-days and 9-days stood at 60.83, 73.95 and 80.19 respectively. Also, the stockâs 3-days RSI stood at 89.68.
