


MJ Gleeson PLC
United Kingdom-based MJ Gleeson PLC (GLE) is involved in providing two businesses: strategic land trading, mainly in the South of England and house building on brownfield land in the North of England. The companyâs business is differentiated in two segments: Gleeson Homes and Gleeson Strategic Land.
GLE-Financial Highlights for FY2019
In FY2019, the companyâs volume was up by 25 per cent to 1,529 units sold as compared with the financial year of 2018 of 1,225 units. For the year 2019, the companyâs revenue increased by 27 per cent to £249.9 million against the £196.7 million in 2018, due to revenue in Gleeson Homes which surged by 28.4 per cent as a result of a 24.8 per cent surge in the number of homes sold and a surge in average selling price (ASP) by £3,700 in the reported year. In Gleeson Strategic Land, the revenue rose by £9.6 million to £52.9 million, mainly driven by the mix of sites sold in the year. Operating profit from continuing operations increased by 11 per cent to £41 million against the £36.9 million in FY18, driven by robust trading results in both Gleeson Strategic Land and Gleeson Homes. Profit before tax climbed by 11.4 per cent to £41.2 million in FY19 from £37 million in FY18. Reported basic earnings per share (EPS) from discontinued and continuing operations surged by 9.7 per cent to 61.0 pence as compared to the previous year.
In the financial year 2019, the return on capital employed (ROCE) reduced by 70 basis points to 25.9 per cent against the 26.6 per cent in FY18, reflecting growth and surge in capital employed, which surged to £170.9 million in FY19 from £143.1 million in FY18. This surge was due to increased investment in build WIP in Gleeson Homes and increased net receivables in Gleeson Strategic Land. Cash and cash equivalents declined by 27 per cent to £30.3 million against the £41.3 million in FY18. The groupâs board proposed a final dividend per share of 23 pence. The dividend per share for the full year 2019 increased by 7.8 per cent to 34.5 pence against the 32 pence in FY18. During the year 2019, shareholdersâ funds surged by 8.4 per cent to £203.9 million. Net assets per share rose by 8.4 per cent to 374 pence against the 345 pence in FY18.
The company has once again delivered an excellent performance with decent operating profit in both divisions. Despite the uncertainties caused by Brexit, demand for the homes continues to be extremely robust. The company remain comfortably on track to attain the target of doubling Gleeson Homesâ sales to two thousand units per annum across the five years from 2017 to 2022. The homes continue to remain extremely affordable, and mortgage finance remains willingly available. The uplift in dividend signals the self-assurance in continued cash generative progress.
In the target areas, the company has a great deal of land available and prospects for the group to grow. The companyâs unique business model of building low-cost houses in the Midlands and the North of England and planned land sales in the South endures delivering excellent results. The company has a robust portfolio of sites and expects that it will remain to keep its effective track record in promoting potentially high-value expansions with the planning system.
GLE-Share price performance
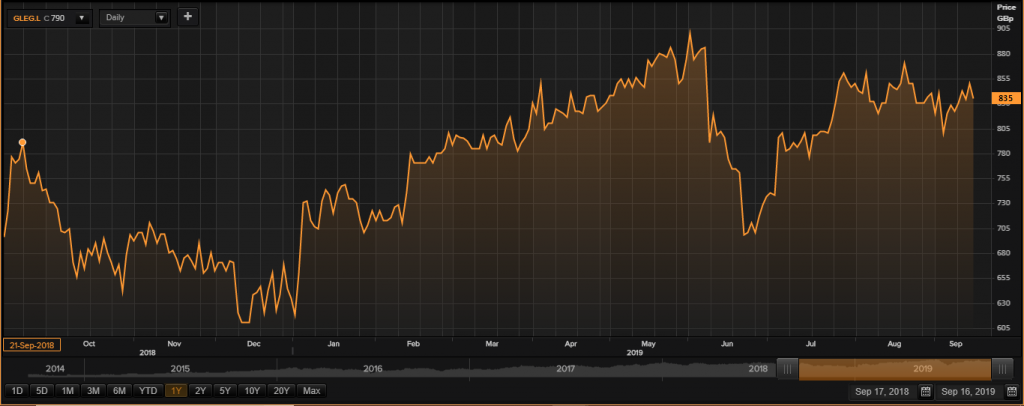
Daily Chart as on 16-September-19, before the market close (Source: Thomson Reuters)
On 16th September 2019, while writing at 02:10 PM GMT, MJ Gleeson PLC shares were clocking a current market price of GBX 835 per share; which was less by 1.76 per cent in comparison to the last traded price of the previous day. The companyâs market capitalisation was at £464 million at the time of writing.
On 3rd June 2019, the shares of GLE have touched a new peak of GBX 900 and reached the lowest price level of GBX 600 on 14th December 2018 in the last 52 weeks. The companyâs shares were trading 7.22 per cent lower from the 52-week high price mark and 39.16 per cent higher than the 52-week low price mark at the current trading level, as can be seen in the price chart.
The stockâs traded volume was hovering around 26,035 at the time of writing before the market close. The companyâs 5-day stock's average traded volume was 7,051.60; 30 days average traded volume- 35,769.37 and 90 days average traded volume â 54,266.36. The volatility of the companyâs stock was 72 per cent lower as compared with the index taken as the benchmark, as the beta of the companyâs stock was recorded at 0.28 with a dividend yield of 4.06 per cent.
The shares of the company have delivered a positive return of 5.99 per cent in the last quarter. The companyâs stock surged by 31.99 per cent from the start of the year to till date. The companyâs stock has given investors 21.78 per cent of a positive return in the last year.Â
Horizon Discovery Group PLC
Horizon Discovery Group Plc (HZD) is a Pharmaceuticals & Biotechnology company based out of UK and is engaged in activities related to gene modulation and gene editing. With the use of these technologies, the researchers can modify almost any modulate or gene to create models that copy the abnormalities found in cancer-like diseases. The company offers a catalogue of products to build an understanding of genes function across species and genetic drivers of disease to develop gene therapies.
HZD-Financial highlights for H1 FY19
The companyâs revenue (reported) surged by 13.9 per cent to £28.6 million in H1 FY19 as against £25.1 million in H1 FY18. The companyâs gross margin improved by 5.3 percentage points to 68.5 per cent in H1 FY19 as against 63.2 per cent in H1 FY18. The companyâs adjusted EBITDA loss stood at £0.9 million in H1 FY19 as against a loss of £2.2 million in H1 FY18. The company was benefited to the tune of £1.3 million due to IFRS 16 Lease implementation. The companyâs loss post taxation was recorded at £5.3 million in H1 FY19 as against a loss of £7.6 million in H1 FY18. The company had cash balances of £24.8 million at 30th June 2019 as against £24.9 million by the end of H1 FY18. The companyâs operating expenses stood at £25.2 million in H1 FY19 after excluding exceptional items as against £22.1 million in H1 FY18. These are in line with managementâs guidance. The company had overall net assets valued at £136.8 million by the end of H1 FY19 as against £143.3 million at 31st December 2018. The financial health of the company shall allow to invest it in a new e-commerce platform to be launched the current year as a part of a strategic initiative. The company expects to deliver stronger performance in H2 FY19 with a strong order book, a new e-commerce platform and increased 3x capacity (Cell Line engineering).
The company operates in a challenging environment which requires continuous investment, sometimes at the cost of profitability, to stay ahead of competitors. The companyâs operations are impacted by the uncertainty created due to ongoing Brexit as it negatively impacts the companyâs supply chain.
The industry in which company operates has a substantial opportunity and is growing at a rapid pace. The company is the leading innovator in the industry. The companyâs core capability is in cell-line engineering which, help them to create high-value services and tools, which could provide strong prospects for growth and competitive advantage in future.
HZD-Share price performance
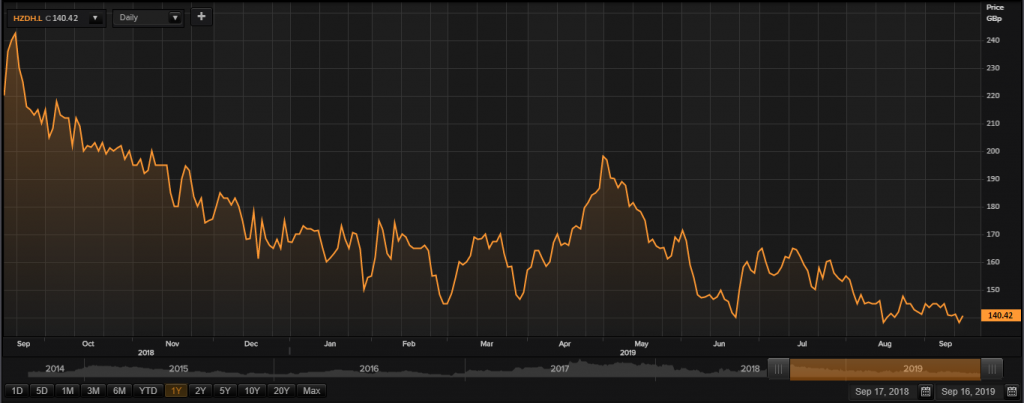
Daily Chart as at 16-September-19, before the market close (Source: Thomson Reuters)
On 16th September 2019, while writing at 02:16 PM GMT, Horizon Discovery Group PLC shares were clocking a current market price of GBX 140.42 per share; which was more by 1.75 per cent in comparison to the last traded price of the previous day. The companyâs market capitalisation was at around £204.81 million at the time of writing.
On 18th September 2018, the shares of HZD have touched a new peak of GBX 252 and reached the lowest price level of GBX 135 on 16th August 2019 in the last 52 weeks. The companyâs shares were trading at 44.27 per cent lower from the 52-week high price mark and 4.01 per cent higher against the 52-week low price mark at the current trading level, as can be seen in the price chart.
The stockâs traded volume was hovering around 36,954 at the time of writing before the market close. The companyâs 5-day stock's average traded volume was 57,181.60; 30 days average traded volume- 54,742.00 and 90 days average traded volume â 255,786.08. The volatility of the companyâs stock was 26 per cent lower as compared with the index taken as the benchmark, as the beta of the companyâs stock was recorded at 0.74.
The shares of the company have delivered a negative return of 5.74 per cent in the last quarter. The companyâs stock plunged by 21.14 per cent from a start of the year to till date. The companyâs stock has given investors 36.70 per cent of a negative return in the last year.Â
