


_06_19_2026_12_34_15_139937.jpg)

EIBâs Pledge to phase out fossil fuel financing
In November 2019, the European Investment Bank (EIB) had agreed to reduce and eventually phase out the financing for fossil fuel-based assets over a period of two years, to become the worldâs first âClimate Bankâ. This decision was made in the continuation of the European Unionâs target of becoming carbon neutral by the year 2050. Under this new policy, the worldâs largest multilateral financial institution was expected to cut down the funding of all oil, gas, and coal projects post the year 2021. It was reported that as a part of this policy, any energy company applying for the funding for their projects would have had to show evidence regarding the production of at least one kilowatt hour (KWh) of energy while letting out even lower than 250 grams of carbon dioxide. This move was applauded by a lot of climate activists stating that this is a significant victory in the fight against climate change, even though some believed that this action was delayed by at least a year than previously anticipated by campaigners.
European Unionâs potential waste of â¬29 billion
As stated above, in its bid to fight climate change, the worldâs largest multilateral financial institution, the European Investment Bank pledged to cut funding for fossil fuel-based projects. Just two months later, various news sources reported that the organisation risks spending â¬29 billion or £25 billion of taxpayersâ money by overinvesting in gas projects which will not be required as a part of the EIBâs climate action plans. The scenario emerged because of the 32 Gas based projects, that are still eligible to receive the funds from the EIB, before the deadline of the complete shut down of such financing. These projects would be left out as âstranded projectsâ after the policy is implemented fully, as per reports, which would lead to a waste of billions in European taxpayersâ money, currently also including the taxpayers from the United Kingdom, until UKâs formal exit from the EU.
Various experts have suggested the argument that these investments would be required as a part of meeting European Unionâs energy demand, which have been debunked as per the report, which explain how this system would confine the EUâs energy system to fossil gas-based assets for another 40 years. The experts, as well as the climate activists have voiced that it will be important to prioritise green energy investments above and beyond the European as well as the international gas industry, which can be backed by the existing technology that will be required to deliver the renewable energy.
Latest News from the Climate Action Plan from the United Kingdom
On 20th January 2020, various media channels criticised Prime Minister Boris Johnsonâs claims about the potential achievements from the UK Climate Summit, slated to be held later during the year. Johnson previously stated that the summit to be held in Glasgow, Scotland would be able to deliver âenforceableâ cuts. This comes after various experts suggested that one of the biggest weakness of the Paris Climate Agreement was the fact that it failed to put limits on the production of energy based on fossil fuels. Activists and green energy campaigners do not believe that this is something that the Prime Minister can deliver on, some even suggesting that these are âvague pledges without any substanceâ. The criticism has come, following the failure of the Johnson Administration to deliver the world-first legal commitment, that would be required the net-zero emissions target by 2050 that the United Kingdom has set for itself. Prime Ministerâs statement has also been criticised, due to the fact that âUKâs Climate Action Planâ was rarely spoken about during the election campaign in December last year.
Now we will discuss the share price performance of some oil and gas companies, trading on the FTSE, which may see a significant move because of these policies and plans and could be the key stocks to watch out during 2020.
Energean Oil and Gas Plc (LON:ENOG) Share Price Performance
On 20th January 2020, at around 01:40 P.M GMT, at the time of writing, Energean Oil and Gas Plcâs share price has been reported to be at GBX 867.00 per share on the London Stock Exchange market, a drop in the price of 0.91 per cent or GBX 8.00 per share, as opposed to the last trading dayâs closing price, that has been reported to be at GBX 875.00 per share. Market Capitalisation (M-Cap) of Energean Oil and Gas Plc was reported to be at £1.549 billion in reference to the value at which the companyâs share was trading at the time of writing.
The companyâs share has depicted a positive change of around 37.62 per cent, within the last 12 months, from the price of GBX 630.00, at which the companyâs share was trading as on January 21, 2019. Though, the Energean Oil and Gas Plc share have given a negative return in the last six months, of approximately 10.80 per cent compared to the share price of GBX 972.00 which was set by Energean Oil and Gas Plcâs share as on July 19, 2019. The companyâs share has also given a negative return of around 4.73 per cent, in last one monthâs time from the share price of GBX 910.00 per share that the share achieved at the close of the market on December 20, 2019.
Â
Diversified Gas and Oil Plc (LON:DGOC) Share Price Performance
On 20th January 2020, at around 01:45 P.M GMT, at the time of writing, Diversified Gas and Oil Plcâs share price has been reported to be at GBX 102.50 per share on the London Stock Exchange market, a fall in the price of 0.48 per cent or GBX 0.50 per share, as opposed to the last trading dayâs closing price, that has been reported to be at GBX 103.00 per share. Market Capitalisation (M-Cap) of Diversified Gas and Oil Plc was reported to be at £673.06 million in reference to the value at which the companyâs share was trading at the time of writing.
The companyâs share has reportedly depicted a negative return of approximately 12.02 per cent, within the last 12 months, from the price of GBX 116.50, at which the companyâs share was trading as on January 21, 2019.
Hurricane Energy Plc (LON:HUR) Share Price Performance
On 20th January 2020, at around 01:50 P.M GMT, at the time of writing, Hurricane Energy Plcâs share price has been reported to be at GBX 25.10 per share on the London Stock Exchange market, a drop in the price of 1.95 per cent or GBX 0.50 per share, as opposed to the last trading dayâs closing price, that has been reported to be at GBX 25.60 per share. Market Capitalisation (M-Cap) of Hurricane Energy Plc was reported to be at £509.50 million in reference to the value at which the companyâs share was trading at the time of writing.
The companyâs share has reportedly depicted a negative return of approximately 46.80 per cent, within the last 12 months, from the price of GBX 47.18, at which the companyâs share was trading as on January 21, 2019. The companyâs stock beta was reported at a value of 1.13.
Â
Tullow Oil Plc (LON:TLW) Share Price Performance
On 20th January 2020, at around 01:55 P.M GMT, at the time of writing, Tullow Oil Plcâs share price has been reported to be at GBX 54.80 per share on the London Stock Exchange market, a jump in the price of 2.70 per cent or GBX 1.44 per share, as opposed to the last trading dayâs closing price, that has been reported to be at GBX 53.36 per share. Market Capitalisation (M-Cap) of Tullow Oil Plc was reported to be at £751.25 million in reference to the value at which the companyâs share was trading at the time of writing.
The companyâs share has reportedly depicted a negative return of approximately 73.04 per cent, within the last 12 months, from the price of GBX 203.30, at which the companyâs share was trading as on January 21, 2019. The companyâs stock beta was reported at a value of 1.35.
Comparative share price chart of ENOG, DGOC, HUR and TLW
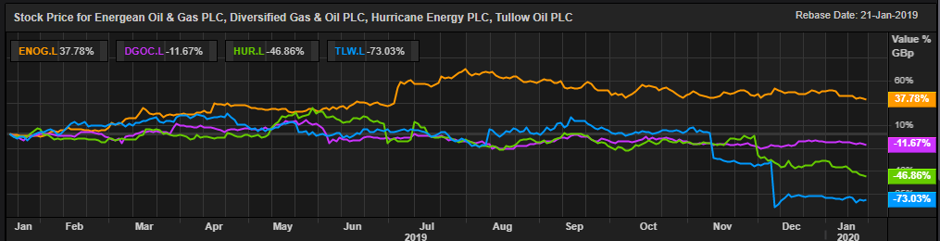
(Source: Thomson Reuters) Daily Chart as on 20-January-20, before the closing of the LSE Market
