


Increase in Overdraft Fees
Various media reports have suggested that millions of customers of the Lloyd Banking Group and its other brands such as Halifax and the Bank of Scotland will be charged a fee of up to 49.9 per cent for overdrafts, beginning April this year. The bank has around 22 million current account customers, including those of its subsidiaries.
This announcement makes the Lloyd groupâs overhaul on overdraft rules, the biggest ever and has come as a response to the ban on excessive fees demanded last year by the Financial Conduct Authority (FCA) which is the Industry Regulator.
The demand of High Fee ban by the FCA
On 7th June 2019, the Financial Conduct Authority, released a press notification, to confirm its response on the overdraft fees being charged by the high street banks, calling the overdraft market dysfunctional, not working properly. It announced that it would be introducing certain reforms, to overhaul the system so that banks only engage in fair market practices, rather than predatory practices.
The talk of the reforms, of late, started in the month of December 2018, when the FCA first announced that it would be looking to review the situation in which banks are charging extremely high and unfair overdraft fees. The FCA said that this system needed a fundamental change. The first plan was to do away with the current range of monthly charges, being charged by the banks on unauthorised overdrafts, and replace it with a single interest rate, as in the case of formal borrowings. The FCA reported that a customer who exceeds their facility by £100 for just a single week are sometimes liable to pay as much as £76 in fees. These fees are a major revenue stream for banks as well as for the building and cooperative societies, which earn around £2.4 billion per annum from the fees from such overdrafts. The biggest red flag of the transaction is that around 30 per cent of these fees are charged from unauthorised overdrafts, making it a predatory pricing model, especially because of the fact that around half of all the overdraft fees came from just 1.5 per cent of all the customers in 2016, with customers belonging to the deprived areas being affected the most.
In the 7th June 2019 press release, a change was announced in the system, post the implementation of which, the general cost of borrowing a £100 through an unarranged overdraft will reduce from £5 per day to a little under 20p per day, a reduction of 96 per cent in the fee.
Along with this, the FCA also announced that they would be introducing digital tools, that will support the customers in screening the cheapest overdraft facilities, while it will also provide an overdraft fee calculator, that will give the customers an exact amount in Pounds or GBX, that they will have to pay back on availing an overdraft facility.
Response from Banks
Nationwide became the first overdraft facility provider to move its overdraft fee system to a single interest rate form by charging a rate of 39.9 per cent, which was followed by similar announcements from Banks like HSBC and Santander, with the same rate. The Lloyds group on 22nd January 2019 stated that a large group of its customers would still be charged 39.9 per cent but some of the customers who avail the Unarranged facility will be charged on the higher range of 49.9 per cent. The bank did not comment on the number of its customers who would be charged 49.9 per cent, only responded by saying that around 90 per cent of the customers who avail such a facility will be paying less, as compared to what they pay today.
LLOY Share Price Performance
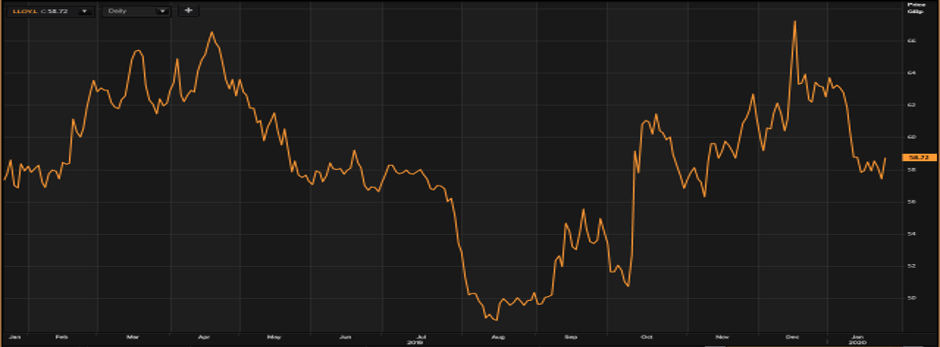
(Source: Thomson Reuters) Daily Chart as on 24-January-20, before the closing of the London Stock Exchange
As on 24th January 2020, (08:30 A.M Greenwich Mean Time), while writing this report, Lloyds Banking Group Plcâs share price has been reported to be at GBX 58.72 per share on the London Stock Exchange, an increase in the price of 2.30 per cent or GBX 1.32 per share, as opposed to the price of the share, at the time of close of trading on the previous day, which was reported at GBX 57.40 per share.
Lloyds Banking Group Plcâs Market Capitalisation (M-Cap) reportedly stood at a value of £40.395 billion with regards, to the price at which the companyâs share was trading at the time of writing.
The companyâs share has depicted a positive change of around 1.80 per cent, in the year gone by, from the price of GBX 57.68, at which the companyâs share was trading as on January 24, 2019. The Lloyds Banking Group Plc share has also given a positive return in the last six months, of approximately 3.07 per cent compared to the share price of GBX 56.97 which was set by Lloyds Banking Group Plcâs share as on July 24, 2019. The companyâs share has given a negative return of around 7.41 per cent, in last one monthâs time from the share price of GBX 63.42 per share that the share achieved at the close of the market on December 24, 2019.
The beta of the share of the company has been reported at a value of 0.75, which basically means that the Lloyds Banking Group Plcâs share has shown less volatility in its movement, as opposed to the volatility of the comparative index in the last twelve months.
In the wake of this development, there has been flutter in UK banking stocks, and there is expected to be significant changes in the stock prices of the major players in the market.
BARC Share Price Performance
As on 24th January 2020, (08:30 A.M Greenwich Mean Time), while writing this report, Barclays Plcâs share price has been reported to be at GBX 174.68 per share on the London Stock Exchange, an increase in the price of 1.85 per cent or GBX 3.18 per share, as opposed to the price of the share, at the time of close of trading on the previous day, which was reported at GBX 171.50 per share.
Barclays Plcâs Market Capitalisation (M-Cap) reportedly stood at a value of £29.707 billion with regards, to the price at which the companyâs share was trading at the time of writing.
The companyâs share has depicted a positive change of around 7.39 per cent, in the year gone by, from the price of GBX 162.66, at which the companyâs share was trading as on January 24, 2019. The Barclays Plc share has also given a positive return in the last six months, of approximately 9.23 per cent compared to the share price of GBX 159.92 which was set by Barclays Plcâs share as on July 24, 2019. The companyâs share has though given a negative return of around 2.96 per cent, in last one monthâs time from the share price of GBX 180.00 per share that the share achieved at the close of the market on December 24, 2019.
The beta of the share of the company has been reported at a value of 0.87, which basically means that the Barclays Plcâs share has shown less volatility in its movement, as opposed to the volatility of the comparative index in the last twelve months.
RBS Share Price Performance
As on 24th January 2020, (08:30 A.M Greenwich Mean Time), while writing this report, Royal Bank of Scotland Group Plcâs share price has been reported to be at GBX 226.90 per share on the London Stock Exchange, an increase in the price of 3.56 per cent or GBX 7.80 per share, as opposed to the price of the share, at the time of close of trading on the previous day, which was reported at GBX 219.10 per share.
Royal Bank of Scotland Group Plcâs Market Capitalisation (M-Cap) reportedly stood at a value of £26.497 billion in reference with the share price of the company, while writing this report.
The companyâs share has depicted a negative change of around 5.85 per cent, in the year gone by, from the price of GBX 241.00, at which the companyâs share was trading as on January 24, 2019. The Royal Bank of Scotland Group Plc share has also given a negative return in the last six months, of approximately 0.57 per cent compared to the share price of GBX 228.20 which was set by Royal Bank of Scotland Group Plcâs share as on July 24, 2019. The companyâs share has also given a negative return of around 6.66 per cent, in last one monthâs time from the share price of GBX 243.10 per share that the share achieved at the close of the market on December 24, 2019.
The beta of the share of the company has been reported at a value of 1.01, which basically means that the Royal Bank of Scotland Group Plcâs share has shown similar volatility in its movement, as of  the comparative index in the last twelve months.
Comparative share price chart of BARC and RBS
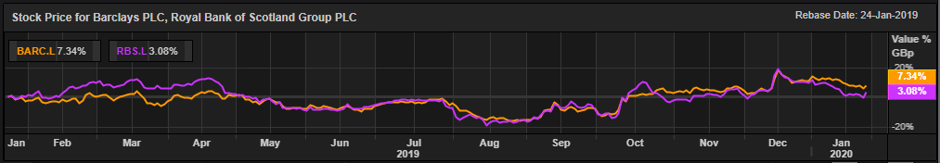
(Source: Thomson Reuters) Daily Chart as on 24-January-20, before the closing of the London Stock Exchange
