


About - Sylvania Platinum Ltd
Sylvania Platinum Limited (SLP) is a Hamilton, Bermuda-based producer of PGMs (platinum group metals), including platinum, palladium and rhodium. The group is involved in the mining of platinum group metals from chrome dumps, investment in mineral exploration. The companyâs business is differentiated in various segments: Mill sell, Steelpoort, Lannex, Mooinooi, Doornbosch, Tweefontein, Exploration projects and Corporate/Unallocated.
SLP Financial Highlights for FY19 period ended 30th June 2019
The companyâs net revenue surged by 12 per cent to $70.5 million in FY19 as against $62.8 million in FY18. The companyâs EBITDA surged by 36 per cent to $30.2 million in FY19. The companyâs net profit surged by 66 per cent to $18.2 million in FY19. The companyâs revenues are recorded in USD, whereas the costs incurred are recorded in GBP, ZAR and USD. The companyâs basic EPS surged by 66 per cent to 6.37 cents per share in FY19 as against 3.83 cents per share in FY18. This year the company has doubled the dividend to 1 cent per share as recommended by the board of directors, which will be payable in November 2019. This year, the company had cash balances of $21.8 million with nil debt and obligations. The companyâs tax expense was recorded at $6.2 million in FY19. The company had shown improvement in its top-line and bottom-line performance in FY19.
However, the company continues to face challenges with respect to utility infrastructure and disruption of power. The climatic change is happening across the world, and the company continues to fight drought and water shortage at Lesedi.
The company is well poised for expansion of projects with zero obligations and a positive cash balance. At Lesedi, the company aims to implement operations continuity by adding new water boreholes and water supply line along with water storage facility(dam).
SLP Share price performance
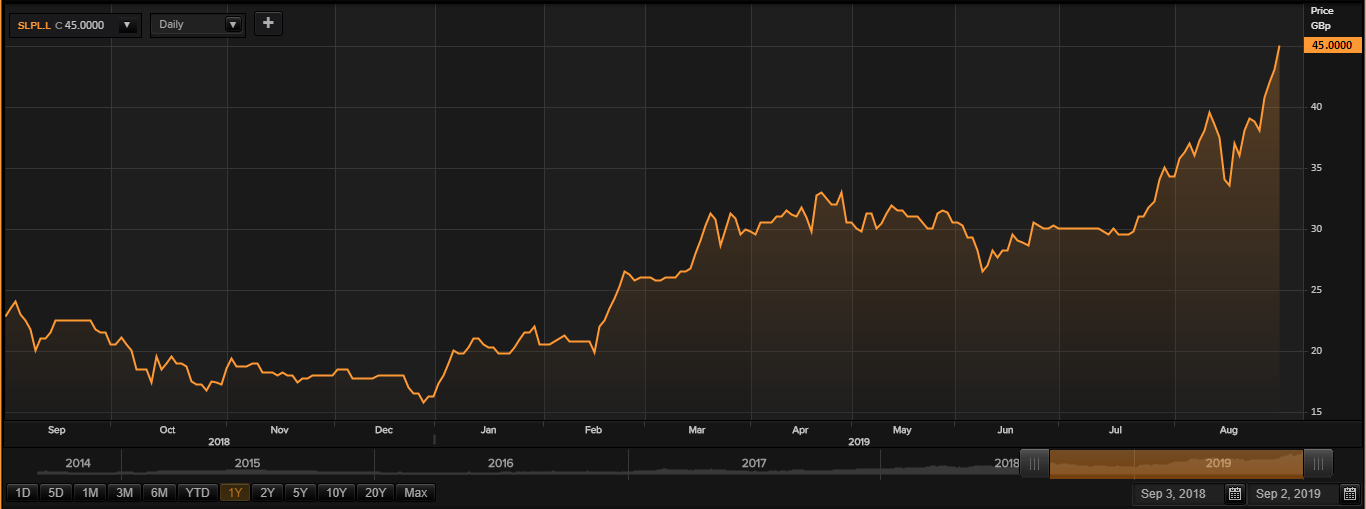
Daily Chart as on 02-September-19, before the market close (Source: Thomson Reuters)
On 2nd September 2019, at 01:18 PM GMT while writing, SLP shares were trading at GBX 45 per share; which were up by 4.65 per cent as compared to the closing price level of the previous day. The companyâs M-cap (market capitalisation) was recorded at £123.09 million at the time of writing.
On 2nd September 2019, the shares of SLP have touched a new peak of GBX 45.00 and reached the lowest price level of GBX 15.5 on 28 December 2018 in the last 52 weeks. The companyâs shares were trading at a new high at the 52-week high price mark and 190.32 per cent higher than the 52-week low price mark at the current trading level, as can be seen in the price chart.
The stockâs traded volume was hovering around 1,752,615 at the time of writing before the market close. The companyâs 5-day stock's average traded volume was 839,068.40; 30 days average traded volume- 796,411.93 and 90 days average traded volume â 509,471.09. The companyâs stock was less volatile in comparison with the index considered as the benchmark as the beta of the companyâs stock was recorded at 0.28.
The shares of the company have delivered a positive return of 37.38 per cent in the last quarter. The companyâs stock rocketed by 164.62 per cent from start of the year to till date. The companyâs stock has generated a positive return of 91.11 per cent in the last year.Â
About - Kodal Minerals Plc
Kodal Minerals Plc (KOD) is an exploration and evaluation company. The company explores mineral resources across the United Kingdom, Norway and West Africa. The companyâs business is divided into two segments: the Kodal Project segment and the Grimeli Project segment. The group holds an interest in about four exploration businesses and over two business applications in Cote d'Ivoire. The company has an interest in two projects in Mali as well: the Nangalasso situated in southern Mali and the SLAM Project situated in south-west Mali.
KOD Financial Highlights for FY19 period ended 31st March 2019
The company recorded a loss of £713,000 for the year ended 31st March 2019 before other comprehensive income excluding other income (comprehensive) as against £857,000 in the previous financial year. The company is running its office in Mali, with operations being consistent in comparison with the last year. The company increased its investment in exploration and evaluation in Bougouni Lithium Project and other projects to the tune of £3,463,000 during the year as against £2,190,000 in the previous financial year.
The company made significant progress towards delivering maiden lithium production at flagship Bougouni. Lithium Project is situated in southern Mali, placing Bougouni in the top 15 lithium projects internationally with substantial exploration upside through further exploration across the extensive 450 sq. Km project area.
The companyâs gold projects in Mali and Cote d'Ivoire were valued at £1,070,000 on 31st March 2019 as against £977,000 in FY18. In addition, the companyâs lithium projects in Mali was valued at £5,881,000 in FY19 as against £2,531,000 in FY18. The company saw a decrease of £1,727,000 in cash balances to £1,408,000 in FY19 from the previous year. The companyâs net assets were recorded at £7,803,000 at the end of FY19 as against £6,313,000 in FY18.
KOD Share price performance
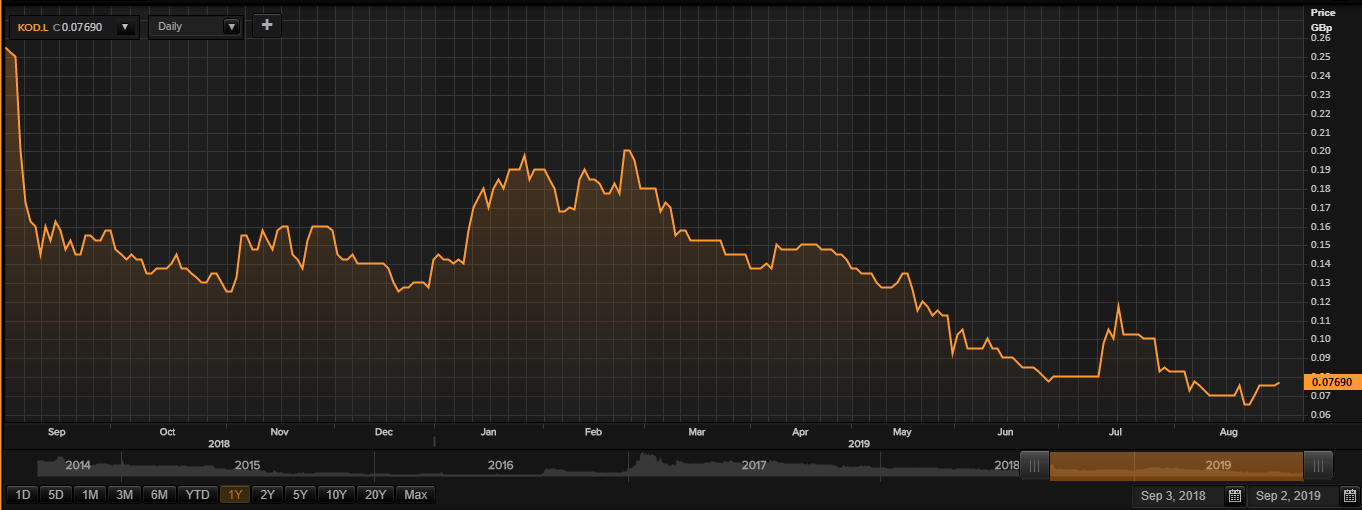
Daily Chart as on 02-September-19, before the market close (Source: Thomson Reuters)
On 2nd September 2019 at 01:25 PM GMT while writing, KOD shares were trading at GBX 0.076 per share; up by 1.33 per cent as compared to the closing price level of the previous day. The companyâs M-cap (market capitalisation) was recorded at £6.75 million at the time of writing.
On 03 September 2018, KOD shares have touched a new peak of GBX 0.2648 and touched the lowest price level of GBX 0.0555 on 21 August 2019 in the last 52 weeks. The companyâs shares were trading at 71.29 per cent lower than the 52-week high price mark and 38.18 per cent higher the 52-week low price mark at the current trading level as can be seen in the price chart.
The stockâs traded volume was hovering around 1,934,439 at the time of writing before the market close. The companyâs 5-day stock's average traded volume was 14,750,804.20; 30 days average traded volume- 36,975,325.67 and 90 days average traded volume â 32,207,763.59. The stock of the company was more volatile in comparison with the index considered as the benchmark, with the beta of the companyâs stock recorded at 1.93.
The shares of the company have delivered a negative return of 33.33 per cent in the last quarter. The companyâs stock plunged by 41.18 per cent from start of the year to till date. The companyâs stock has given a negative return of 70.59 per cent in the last year.Â
About - Maintel Holdings PLC
Maintel Holdings Plc (MAI) spans its telecom operations across the United Kingdom, which includes fixed-line, mobile and data services to the corporate sector. The services include sale and installation of these telecommunication systems. The companyâs portfolio includes fixed-line services with calling facility, cellular services, data services and the internet.
MAI Financial highlights for H1 FY19 period ended 30th June 2019
The companyâs revenue surged by 3 per cent to £64.5 million in H1 FY19 as against £66.5 million in H1 FY18. This can be attributed to the transition of customers to a cloud service model. Also, the company has revised the prices downward as customers upgrade from existing hardware platforms to modern software-based technology. The companyâs recurring revenue was consistent in comparison to the previous year. The companyâs profit before taxation (adjusted) was recorded at £4.9 million in H1 FY19 as against £4.2 million in H1 FY18. The companyâs profit before taxation (unadjusted) was recorded at £1.5 million in H1 FY19 as against £0.3 million in H1 FY18. The companyâs earnings per share was recorded at 10.6 pence per share in H1 FY19 as against loss per share of 2.6 pence per share. The company generated an exceptional income of £12,000 in H1 FY19. The company paid an interim dividend of 15 pence per share on 4th October 2018. The company paid a final dividend of 19.5 pence per share on 16th May 2019.
MAI Share price performance
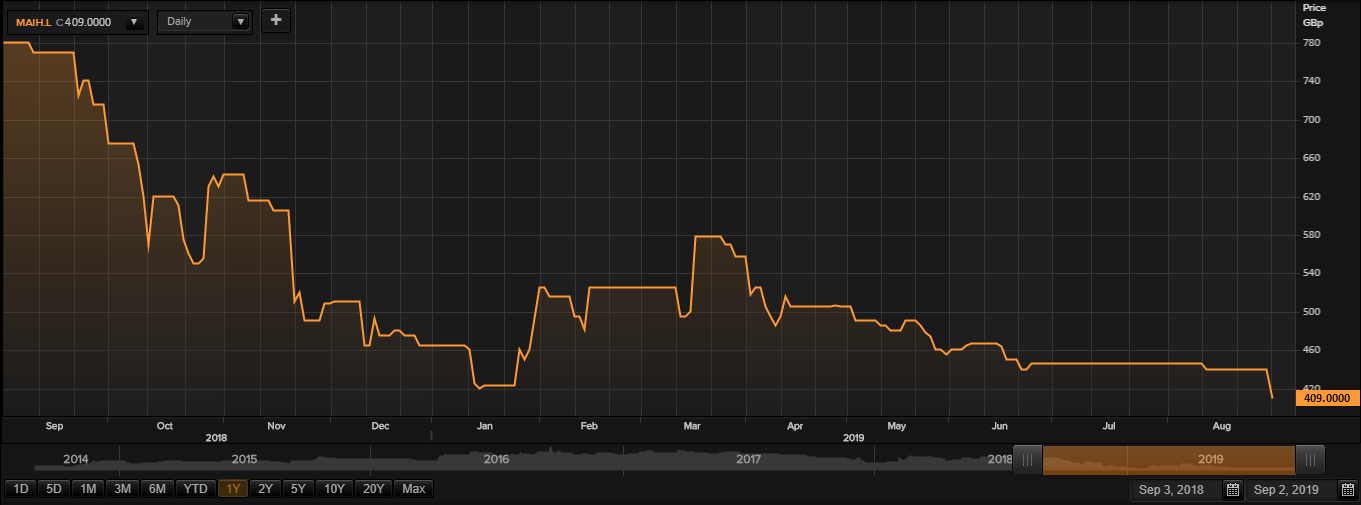
Daily Chart as on 02-September-19, before the market close (Source: Thomson Reuters)
On 2nd September 2019 at 01:31 PM GMT while writing, MAI shares were trading at GBX 409 per share; down by 7.04 per cent as compared to the previous day closing price level. The companyâs M-cap (market capitalisation) was recorded at £63.02 million at the time of writing.
On 06 September 2018, MAI shares have touched a new peak of GBX 800.00 in the last 52 weeks and touched the lowest price level in dayâs trade. The companyâs shares were trading at 48.87 per cent lower than the 52-week high price mark and 0.73 per cent higher the 52-week low price mark at the current trading level as can be seen in the price chart.
The stockâs traded volume was hovering around 6,050 at the time of writing before the market close. The companyâs 5-day stock's average traded volume was 1,831.20; 30 days average traded volume- 3,507.73 and 90 days average traded volume â 5,214.92. The companyâs stock was less volatile in comparison with the index considered as the benchmark as the beta of the companyâs stock was recorded at 0.06.
The shares of the company have delivered a negative return of 4.35 per cent in the last quarter. The companyâs stock plunged by 5.38 per cent from the start of the year to till date. The companyâs stock has given a negative return of 43.59 per cent in the last year.Â
