


_10_04_2024_16_38_50_427275.jpg)

Resolute Mining Ltd
Resolute Mining Limited (RSG) is an Australia based gold mining company. The company owns 3 gold mines, the Ravenswood Gold Mine in Australia, the Bibiani Gold Mine in Ghana and the Syama Gold Mine in Mali. The company holds over 30 years of experience in exploring, developing and operating gold mines in the region of Australia and Africa. The companyâs Syama mine is a having a production capacity of over 300,000oz of gold annually.
The Syama is a world-class, strong mine with a long-life capability. The company is presently implementing automation in the worldâs first underground gold mine in Syama which would be capable of operating large-scale operations with low costs and will increase mines life beyond the year 2032.
Ravenswood mine in Australia has been providing consistent performance for the company for over a decade. The companyâs underground mine at Mt Wright is a low cost, capable of large-scale operations with a long life is a part of the companyâs Ravenswood Expansion Project.
The Bibiani mine had a potential of higher margins from its operations for a longer duration with a growth opportunity for the company.
On 20th June 2019, Thursday, the Resolute Mining Limited announced the admission for trading on the LSEâs (London Stock Exchange) main market. The trading commenced on 20th June 2019 at 8:00 AM GMT under the ticker LSE: RSG.
Trading Update
For the Quarter ending 31st March 2019, the companyâs gold production stood at 98,105oz at an All in Sustaining Costs (AISC) of AUD 1,039/oz or USD 740/oz. The company received an Average gold price of AUD 1,791/oz or USD 1,276/oz on total sales of 108,024oz. The commercial production at Syama Underground is targeted for the quarter ending September 2019. The company signed New Mali Mining Convention for improved operational and financial conditions for Syama. The companyâs permit for mining in Syama extended for 10 years. The companyâs Global Mineral Resources and Ore Reserves stood at 16.6Moz and 5.7 Moz respectively as at 31st December 2018. As per the companyâs exploration program, Tabakoroni provided robust results with Mineral Resource of gold graded at 5.1 gram/ tonne with over 1 million ounces of production. The company prepared for its stock listing in the LSE (London Stock Exchange). The companyâs Cash, listed investments and bullion stood at AUD 86 million or USD 61 million as at 31st March 2019.
Financial Highlights â H1 Financial Year 2019 (AUD, thousand)
(Source: Interim Report, Company Website)
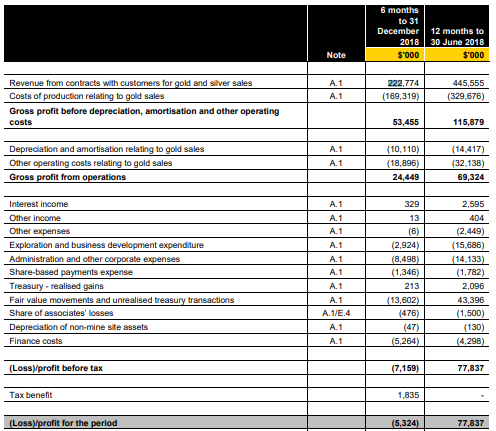
For the first half of the financial year 2019 ending 31st December 2018, the companyâs reported revenue from sales of gold and silver stood at AUD 222,774 thousand versus full-year sales of AUD 445,555 thousand ending June 2018.
The companyâs gross profit before depreciation, amortisation and other operating costs stood at AUD 53,455 thousand for H1 FY2019 versus AUD 115,879 thousand for the FY2018.
The company reported a loss before tax of AUD 7,159 thousand in the first half of the financial year 2019 versus a profit before tax of AUD 77,837 thousand for the financial year 2018.
The company reported a loss after tax of AUD 5,324 thousand in the first half of the financial year 2019 versus a profit after tax of AUD 77,837 thousand for the financial year 2018.
The companyâs basic loss per share stood at 0.44 cents for the H1 FY2019 against earnings per share of 8.85 cents for FY2018. The companyâs diluted loss per share stood at 0.44 cents for the H1 FY2019 against earnings per share of 8.72 cents for FY2018.
In the first half of the financial year 2019, the companyâs reported cash balance was AUD 38,717 thousand versus AUD 42,445 thousand for the financial year 2018.
The companyâs Net assets stood at AUD 700,699 thousand as at 31st December 2018 against AUD 708,642 thousand as at 30th June 2018.
The companyâs cash flow from operating activities remained at AUD 33,849 for the first half of the financial year 2019 ending December 2018 versus an operating cash flow of AUD 28,359 in the financial year ending June 2018.
Resolute Mining Ltd Share Price Performance
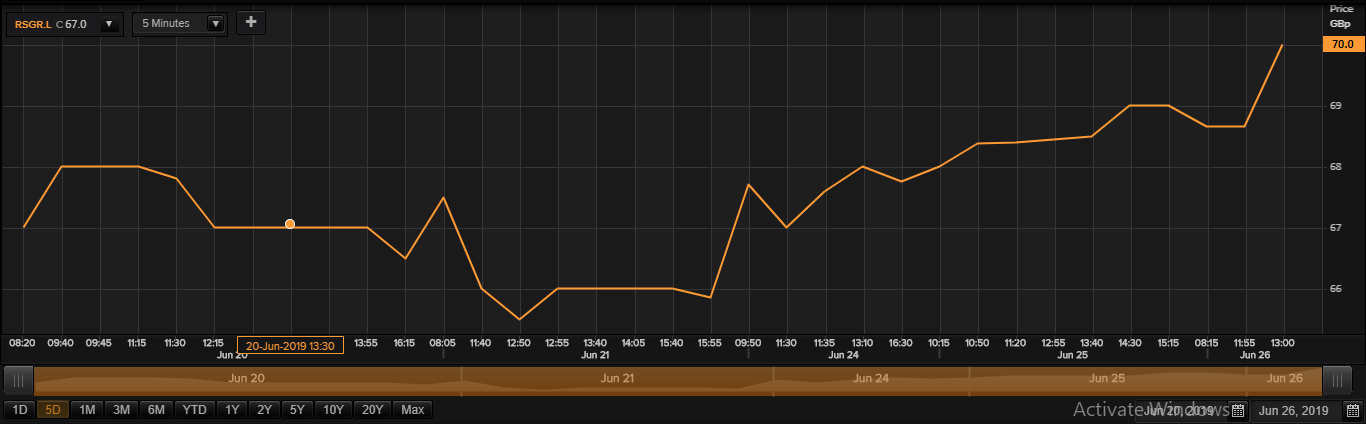
Daily Chart as at June-26-19, before the market close (Source: Thomson Reuters)
On 26 June 2019, at the time of writing (before market close, GMT 02:00 PM), Resolute Mining Limited shares were trading at GBX 70.00, up by 0.36 per cent against the previous day closing price. Stock's 52 weeks High and Low is GBX 70.00/GBX 65.50. The companyâs outstanding market capitalisation was around £510.53 million with a dividend yield of 1.59 per cent.
Bluebird Merchant Ventures Ltd.
Bluebird Merchant Ventures Ltd (BMV) is an Industrial Metals company engaged in the Batangas Gold Project (BGP). The company is also involved in the business of trading of copper concentrates and commodity trading through acquisition and expansion. The companyâs BGP is an exploration asset located within the geography of the Philippines. The company had also entered into a JVA (joint venture agreement) with Red Mountain Mining Singapore Ltd (RMMS) and Red Mountain Mining Ltd (RMX).
Recently the company had announced the permitting process for reopening of gold mines in the region of Gubong and Kochang. On 9th April 2019, the company submitted additional information to the Provincial Government related to technical nature for its Gubong Application. The company provided its CDP (Community Development Programme) with a letter signed by local residents in support of reopening the mine.
On 12th March 2019, the company made permitting application for the development of Kochang Mine. The request was progressed quickly with the requirement of minimal additional information by the local authorities.
Financial Highlights â H1 Financial Year 2019 (USD)
(Source: Interim Report, Company Website)
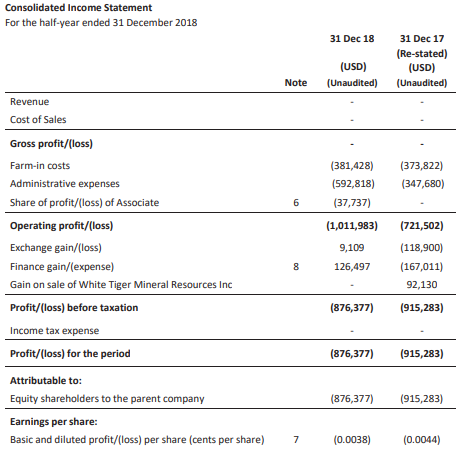
For the first half of the financial year 2019 ending 31st December 2018, the company was in the development phase and has not started generating any revenue.
The companyâs operating loss stood at USD 1,011,983 for H1 FY2019 versus an operating loss of USD 721,502 for the FY2018.
The company reported a loss before tax and after tax of USD 876,377 in the first half of the financial year 2019 versus a loss before tax and after tax of USD 915,283 for the financial year 2018.
The companyâs basic loss per share stood at 0.0038 cents for the H1 FY2019 against a loss per share of 0.0044 cents for FY2018.
In the first half of the financial year 2019, the companyâs reported cash and cash equivalent balance was USD 32,797 versus USD 41,082 for the financial year 2018.
The companyâs Net assets stood at USD 814,692 as at 31st December 2018 against USD 391,076 as at 30th June 2018.
The companyâs net cash flow from operating activities remained negative at USD 775,909 for the first half of the financial year 2019 ending 31st December 2018 versus a negative operating cash flow of USD 460,626 in the first half of the financial year 2018.
The companyâs cash flow from financing activities remained at USD 753,927 for the first half of the financial year 2019 ending 31st December 2018 versus a financing cash flow of USD 395,047 in the first half of the financial year 2018.
Bluebird Merchant Ventures Ltd Share Price Performance
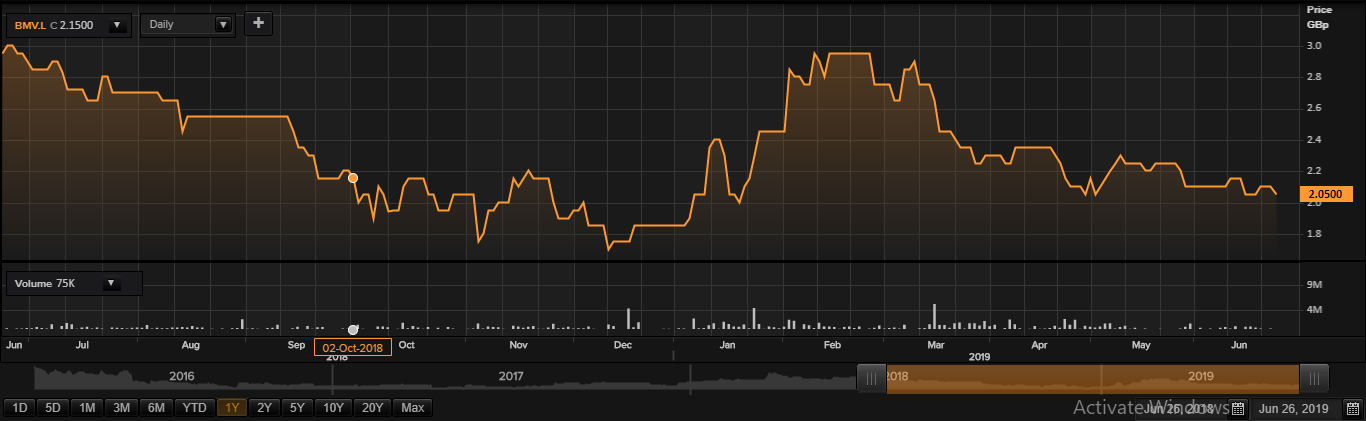
Daily Chart as at June-26-19, before the market closed (Source: Thomson Reuters)
At the time of writing (as on June 26, 2019, at 2:04 PM GMT), shares of Bluebird Merchant Ventures Ltd were trading at GBX 2.05/share and declined by 2.38 per cent against the yesterday's closing price level. The companyâs outstanding market capitalisation stood at around £7.77 million.
In the last 52-wks, shares of Bluebird Merchant Ventures Ltd have registered a high of GBX 3.07 (as on Feb 06, 2019) and a low of GBX 1.65 (as on Dec 20, 2018). At the current trading level, as quoted in the price chart, its shares were trading 33.22 per cent below the 52wk high price level and 24.24 per cent above the 52wk low price level.
Today's volume in the shares (at the time of writing, before the market close) was at 14,624. However, the 5-day average daily volume traded in the stock was at 296,182.60, which was 11.06 per cent below the 30-day average daily volume of 333,018.80 traded on the London Stock Exchange.
From the SMA standpoint, at the time of writing, its shares were trading below 200-days SMA, 60-days SMA and 30-days SMA, which indicates a negative trend in the stock price and carrying the potential to move down from the current trading levels.
In the past 1 year, shares of the Bluebird Merchant Ventures Ltd have delivered a negative price return of 28.81 per cent. However, on a year-to-date basis, the stock was up by approximately 13.51 per cent and declined by 10.64 per cent in the past three months.
Share's RSI for the 9-days, 14-days and 30-days were hovering at a normal range and stood at 45.41, 42.79 and 43.43 respectively. However, RSI for 3-days of the stock was at 64.50.
The volatility of the stock for the 200-days, 90-days, 30-days and 10-days were stood at 55.66, 35.74, 24.43 and 30.74 respectively.
