


Jupiter Fund Management Plc - Results for The Year Ended 31 December 2019
(Source: Companyâs filings, London Stock Exchange)
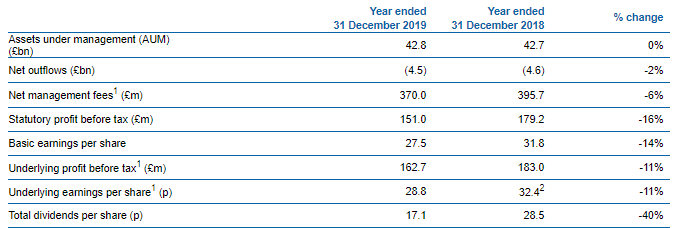
The companyâs Net revenue for the fiscal year 2019 was £379.1 million as compared to £412.7 million in the fiscal year 2018. During the year 2019, the average AUM (assets under management) dipped by 7 per cent in comparison to previous year. The companyâs profit before taxation and exceptional items dipped by 11 per cent to £162.7 million in comparison to 2018, as it has been a challenging year for the industry and Jupiter Fund Management.
The companyâs Statutory profit before taxation was recorded at £151 million in the fiscal year 2019 as compared to £179.2 million in the fiscal year 2018.  In the reported year, 72 per cent of mutual fund AUM delivered above median performance over three years. The companyâs basic EPS decreased to 27.5 pence during the year.
The companyâs Underlying profit before taxation plunged by 11 per cent to £162.7 million in the year 2019. The companyâs Underlying earnings per share decreased by 11 per cent to 28.8 pence during the period. The companyâs total dividend per share stood at 17.1 pence.
About Jupiter Fund Management PLC
Jupiter Fund Management PLC (LON:JUP) is an independent asset management business which manages mutual funds, investment trusts and segregated mandates, operating in the United Kingdom and around the world, on behalf of individuals and institutions. Jupiter Fund Management has a primary objective of delivering superior returns on client assets and help clients to achieve their long-term investment objectives. Jupiter Fund Management manages various asset classes such as equities, fixed income and alternative investments such as absolute return funds. Furthermore, the company offers investment management services to investment trusts and institutional clients with offices in major cities such as London, Luxembourg, Switzerland, Hong Kong and many others.
Based on the size of its AUM and gross sales, Jupiter Fund Management is a market leading fund manager in the UK mutual fund market. In addition, the Group has delivered strong investment performance and has a solid presence in key distribution channels along with strong brand recognition. The company has major exposure of its AUMâs (assets under management of around 88 per cent) in open-ended mutual funds as at 31st December 2019. Majority of these mutual funds have investors from Latin America, Asia, UK, and EMEA. Jupiter Fund Management had approximately £42.8 billion of AUM as at 31st December 2019.
Jupiter Fund Management PLC -Stock price performance
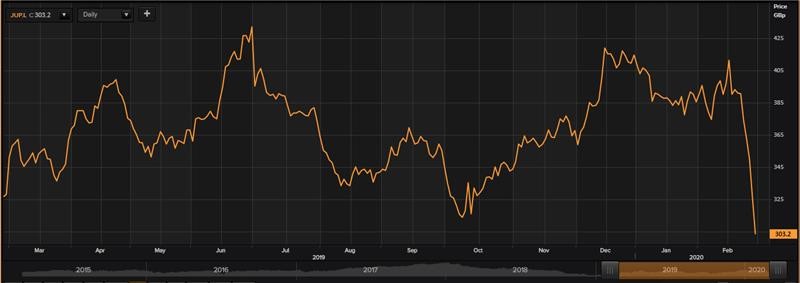
Daily Chart as at Feb-28-20, before the market close (Source: Thomson Reuters)
On 28th February 2020, at the time of writing (before market close, GMT 11:31 AM), Jupiter Fund Management PLCâs shares were trading at GBX 303.50, down by 6.99 per cent against its previous day closing price. Stock's 52 weeks High and Low is GBX 437.80 /GBX 302.30. At the time of writing, the share was trading 30.68% lower than its 52w High and 0.40% higher than its 52w low. The companyâs stock beta was 1.50, reflecting higher volatility as compared to the benchmark index. The outstanding market capitalisation was around £1.49 billion along with an annual dividend yield of 5.24%.
Â
Essentra PLC - Results for The Full Year Ended 31st December 2019
(Source: Companyâs filings, London Stock Exchange)
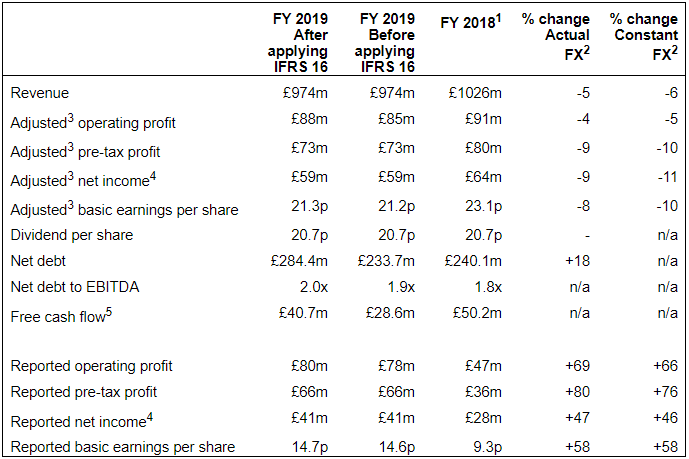
The companyâs revenue, post IFRS 16 adjustments, declined by 6 per cent on constant FX basis to £974 million in the fiscal year 2019 as against £1,026 million in the fiscal year 2018. The companyâs Adjusted operating profit was down by 5 per cent (at constant FX) to £88 million. The companyâs Reported operating profit stood at £80 million in the fiscal year 2019 as against £47.2 million in the fiscal year 2018. The companyâs Adjusted basic EPS, at constant FX, was down by 9.7 per cent to 21.3 pence during the period as against 23.5 pence in the fiscal year 2018. The companyâs Reported basic EPS increased to 14.7 pence in 2019 as against 9.3 pence in 2018. Post IFRS 16 adjustments, the companyâs Net debt stood at £284.4 million during the period. The companyâs annual dividend per share stood at 20.7 pence in 2019. For the fiscal year 2020, the company expects strategic, operational and financial progress.
About Essentra PLC
Essentra PLC (LON:ESNT) is a Milton Keynes, United Kingdom-headquartered manufacturer and supplier of essential components and solutions, including caps, plugs, plastic, fibre, foam and packaging products, which are differentiated in three separate operations, namely Filters, Packaging and Components. The group is the only global independent provider of filters and related solutions to the tobacco industry and is a leading global manufacturer and distributor of a comprehensive range of components, which are used in diverse industrial applications and end-markets. Its products include cartons, leaflets, self-adhesive labels and printed foils used in blister packs, and is one of the very few multi-continental suppliers of a full secondary packaging range to the health and personal care sectors, helping the group to capture a distinct market and maintain margins.
Essentra PLC -Stock price performance
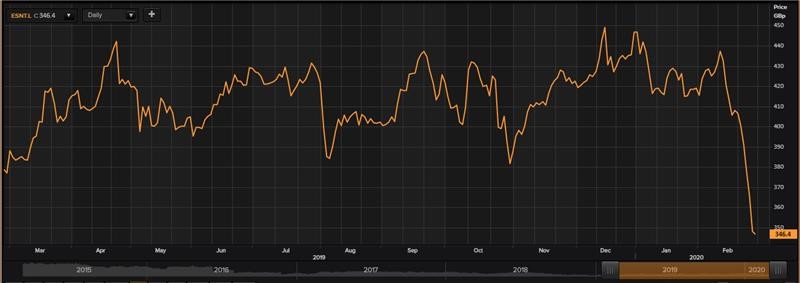
Daily Chart as at Feb-28-20, before the market close (Source: Thomson Reuters)
On 28th February 2020, at the time of writing (before market close, GMT 11:36 AM), Essentra PLCâs shares were trading at GBX 348.01, which remained flat against its previous day closing price. Stock's 52 weeks High and Low is GBX 459.13 /GBX 326.60. At the time of writing, the share was trading 24.20% lower than its 52w High and 6.56% higher than its 52w low. The companyâs stock beta was 1.46, reflecting lesser volatility as compared to the benchmark index. The outstanding market capitalisation was around £915.86 million along with an annual dividend yield of 5.67%.
The Vitec Group Plc - Full Year Results for 2019
(Source: Companyâs filings, London Stock Exchange)
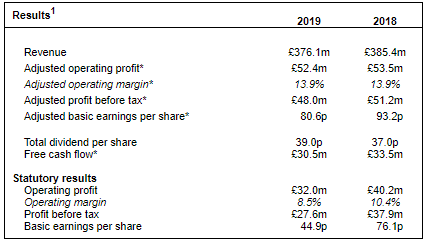
The companyâs Revenue in 2019 plunged by 2.4 per cent to £376.1 million as compared to £385.4 million in the fiscal year 2018 and the adjusted operating profit was down by 2.1 per cent to £52.4 million from £53.5 million in 2018. The Group adjusted gross margin was of 45.2 per cent during the period and in line with the previous year.
The companyâs Adjusted basic earnings per share stood at 80.6 pence per share during the period as against 93.2 pence in 2018. The companyâs Statutory profit before taxation was recorded at £27.6 million in the fiscal year 2019 as against £37.9 million in the fiscal year 2018. The company was in a better financial position now as its net debt (excl. IFRS 16) reduced by £7.4 million to £96.0 million during the period in comparison to previous year. The companyâs total dividend was up by 5.4 per cent to 39 pence per share.
Business overview: Â The Vitec Group plc
The Vitec Group plc (LON:VTC) is quoted on the main market of the London Stock Exchange with revenue of £385.4 million recorded in the financial year 2018. The company provides ultra-premium branded products and solutions to a rapidly growing and fast-moving market. From designing, manufacturing to distribution, the company does it all. The companyâs products include camera systems & accessories, LED lights, noise cancellation equipment, motion sensors, camera mounts, monitors, mobile power, bags and others. The company caters to photographers, independent content creators, enterprises and broadcasters. The companyâs operations can be classified broadly into three categories, namely, Imaging, Production and Creative Solutions. The company has presence across 11 nations with a representative base of 1,800 people.
The Vitec Group plc -Stock price performance
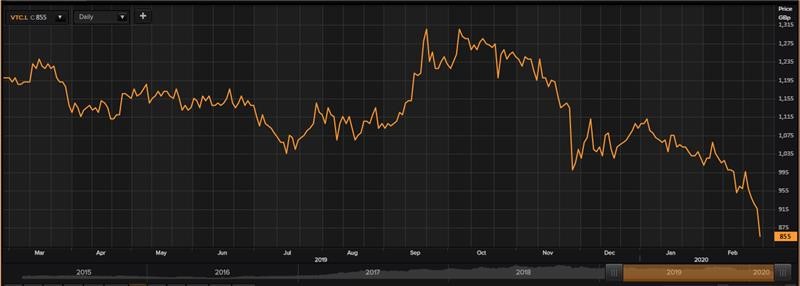
Daily Chart as at Feb-28-20, before the market close (Source: Thomson Reuters)
On 28th February 2020, at the time of writing (before market close, GMT 11:42 AM), The Vitec Group plcâs shares were trading at GBX 854.80, down by 6.68 per cent against its previous day closing price. Stock's 52 weeks High and Low is GBX 1,335.00 /GBX 780.00. At the time of writing, the share was trading 35.97% lower than its 52w High and 9.59% higher than its 52w low. The companyâs stock beta was 0.70, reflecting lesser volatility as compared to the benchmark index. The outstanding market capitalisation was around £417.63 million along with an annual dividend yield of 4.08%.
