


Business overview: RELX PLC
RELX PLC (LON:REL) is a London based worldâs leading global information services company. The company provides information-based analytics and decision tools to customers using innovative solutions which merge content and data with analytics and technology. The groupâs operations are differentiated in four operating segments: Risk & Business Analytics; Exhibitions; Scientific, Technical & Medical; and Legal. The group employees 30,000 plus personnel across 40 nations and has customer base in more than 180 nations across the globe.
RELX reports 2019 results
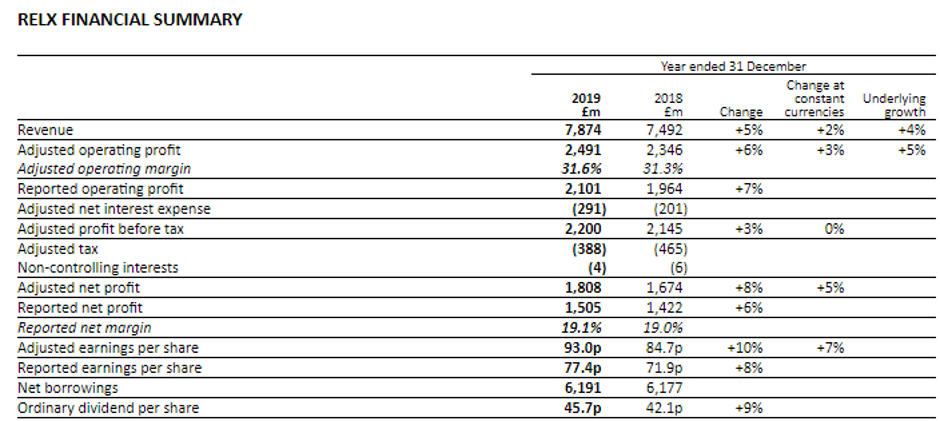
(Source: Companyâs filings, London Stock Exchange)
The companyâs revenue recorded an underlying growth of 4 per cent to £7,874 million in FY19 as against £7,492 million in FY18, capturing good growth in electronic and face-to-face revenues along with analytics and decision tools. Driven by revenue growth and continued operating process innovation, the companyâs Adjusted operating profit achieved underlying growth of 5 per cent to £2,491 million in FY19 as against £2,346 million in FY18.
The companyâs Reported operating profit, which includes amortisation of acquired intangible assets and acquisition-related costs, was up by 7 per cent to £2,101 million in FY19 as against £1,964 million in FY18. The companyâs Reported net interest expense was £305 million during the Financial year 2019, which was higher in comparison to £211 million reported in FY18. The reported tax charge of the company was £338 million in FY19 as against £292 million in FY18.
The Adjusted EPS of the company grew by 7 per cent on a constant currency to 93 pence during the period as compared to 84.7 pence in the prior period. The Reported EPS rose by 8 per cent to 77.4 pence during the period from 71.9 pence in FY18, which includes a credit for gains on disposals and other non-operating items. The company proposed an annual dividend of 45.7 pence during the period, which exceeded the annual dividend in the prior period by 9 per cent.
Â
RELX PLC-Stock price performance

Daily Chart as on 14-February-20, before the market close (Source: Thomson Reuters)
On 14th February 2020, while writing at 09:07 AM GMT, RELX PLCâs shares were clocking a current market price of GBX 2,059 per share. The companyâs market capitalisation was at £39.81 billion at the time of writing.
On 6th February 2020, the shares of RELX have touched a new peak of GBX 2,100.00 and reached the lowest price level of GBX 1,597.00 on 25th March 2019 in the last 52 weeks. The companyâs shares were trading at 1.95 per cent lower from the 52-week high price mark and 28.93 per cent higher the 52-week low price mark at the current trading level as can be seen in the price chart.
The stockâs traded volume was hovering around 531,719 at the time of writing before the market close. The companyâs 5-day stock's daily average traded volume was 3,400,005.00; 30 days daily average traded volume- 2,964,806.83- and 90-days daily average traded volume â 3,092,021.48. The volatility of the companyâs stock was 41 per cent lower as compared with the index taken as the benchmark, as the beta of the companyâs stock was recorded at 0.59 with a dividend yield of 2.21 per cent.
The shares of the company have delivered a positive return of 11.64 per cent in the last quarter. The companyâs stock surged by 8.74 per cent from the start of the year to till date. The companyâs stock has given investors 20.05 per cent of a positive return in the last year.Â
Coca Cola HBC AG
Switzerland based Coca Cola HBC AG (LON:CCH) is engaged in the business of production and distribution of non-alcoholic beverages. The company is a bottler of Coca Cola products. The company distributes Coca-Cola, Coca-Cola Zero, Coca-Cola Light, Fanta, and Sprite as well as water, energy drinks and juice.
CCH announced results for FY19
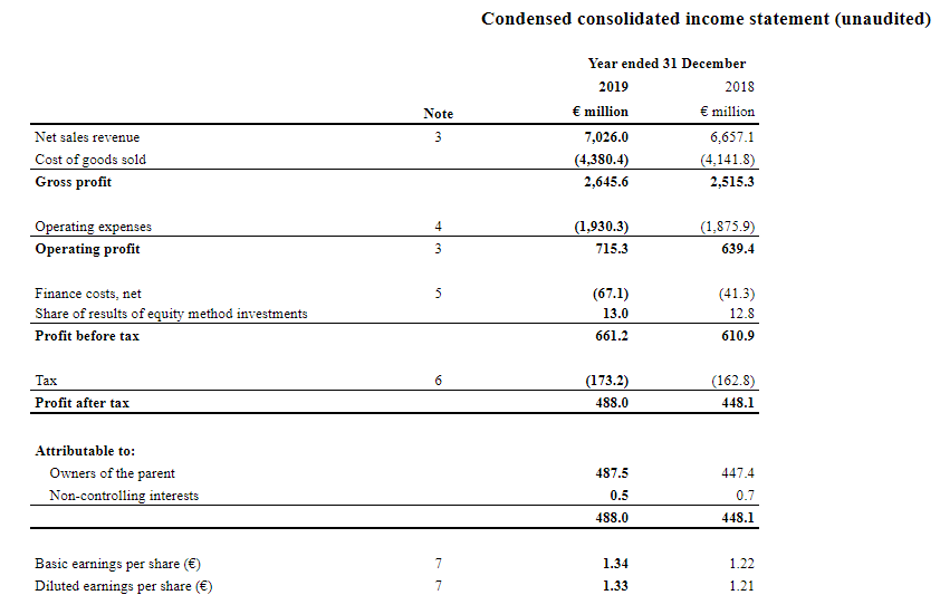
(Source: Companyâs filings, London Stock Exchange)
Backed by the positive contribution from Bambi acquisition and driven by higher volume, pricing, and positive foreign currency movements, the companyâs Net sales revenue improved by 5.5% during 2019. During 2019, on a currency-neutral basis, the net sales revenue of the company improved by 4.4 per cent.
Due to the operating leverage effect of solid revenue growth as well as lower marketing expenses due to the cycling of the investment behind FIFA World Cup, the comparable operating expenses increased by 2.5% and operating expenses increased by 2.9% during 2019, compared to the prior-year period - at a lower rate than the increase in net sales revenue.
Due to the benefits from volume and revenue growth management initiatives as well as the positive contribution from the Bambi acquisition, the comparable operating profit increased by 11.5% and operating profit increased by 11.9% during 2019, compared to the prior-year period.
The company was at a higher level of gross debt and due to adoption of IFRS 16, the new standard on leases, the Net finance costs increased by â¬25.8 million in 2019, compared to the prior-year period. The effective tax rate of the company was 25.8 per cent for the Financial year 2019 and 26.2 per cent for the Financial Year 2018 on a comparable basis. The effective tax rate of the company was 26.2 per cent for the fiscal year 2019 and 26.6 per cent for the fiscal year 2018 on a reported basis. In comparison to the prior-year period, the Comparable net profit increased by 8.7 per cent and net profit by 9 per cent in the fiscal year 2019. The companyâs Net cash from operating activities increased by 16.3 per cent or â¬129.6 million, in 2019, compared to the prior-year period.
In comparison to the prior-year period, the Capital expenditure of the company increased by 13.4 per cent to â¬483.6 million in the fiscal year 2019 as compared to â¬426.6 million in the fiscal year 2018. In 2019, FCF (free cash flow) increased by 19.6 per cent or â¬72.6 million, compared to the prior-year period.Â
Coca Cola -Stock price performance
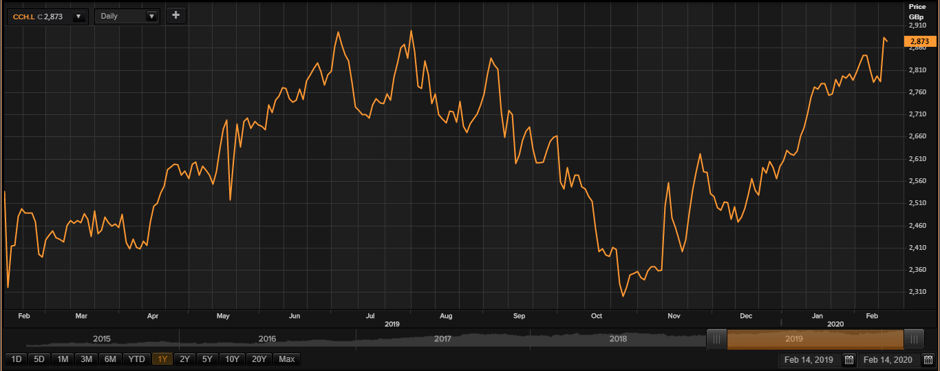
Daily Chart as on 14-February-20, before the market close (Source: Thomson Reuters)
On 14th February 2020, while writing at 09:17 AM GMT, Coca Cola shares were clocking a current market price of GBX 2,873.00 per share. The companyâs market capitalisation was at £10.41 billion at the time of writing.
On 4th July 2019, the shares of Coca Cola have touched a new peak of GBX 2,950.00 and reached the lowest price level of GBX 2,296.00 on 29th October 2019 in the last 52 weeks. The companyâs shares were trading at 2.61 per cent lower from the 52-week high price mark and 25.13 per cent higher than the 52-week low price mark at the current trading level as can be seen in the price chart.
The stockâs traded volume was hovering around 38,030 at the time of writing before the market close. The companyâs 5-day stock's daily average traded volume was 730,231.80; 30 days daily average traded volume- 554,342.03- and 90-days daily average traded volume â 653,473.51. The volatility of the companyâs stock was 32 per cent lower as compared with the index taken as the benchmark, as the beta of the companyâs stock was recorded at 0.68 with a dividend yield of 1.77 per cent.
The shares of the company have delivered a positive return of 15.18 per cent in the last quarter. The companyâs stock surged by 12.40 per cent from the start of the year to till date. The companyâs stock has given investors 13.65 per cent of a positive return in the last year.Â
