

_07_03_2026_03_50_21_133108.jpg)


Barclays, the biggest European financier of fossil fuel companies, is facing major backlash from the UKâs most powerful investor group. The transatlantic consumer and wholesale bank, Barclays Plc has come under fire to adhere to stricter climate policies from the investor forum in the United Kingdom.
Earlier in May, before the bankâs annual shareholder meeting, the Investor Forum, which is one of the largest investors of Britain, had asked Barclays to adopt stricter policies on climate change. Now, spearheaded by the campaign group ShareAction, the bank is under fire from a separate group of 11 financial entities managing more than £130 billion of assets, who has asked the bank to stop servicing the energy companies which fail to comply with the goals of Paris climate summit. The bank was urged to refrain from lending to fossil fuel projects or companies working in the power and gas sector, which fail to comply with the climate targets. According to the Paris summit, the emissions should reach zero by 2050.
The 11 institutional investors backing ShareAction includes the likes of Arcus Foundation, Brunel Pension Partnership, Merseyside Pension Fund, Sarasin & Partners and many others. The Investor Forum and the other members of the UK fund management industry will exert more pressure on the bank.
The UK based bank is being cornered because itâs lending and underwriting projects have been valued at £64 billion in the recent time span of three years and it has emerged as a leader in funding fossil fuel projects.  However, the bank claims that its business with the companies most aggressively expanding in the energy sector fell sharply to $5.2 billion in 2018 from $13.1 billion in 2016. Barclays has also facilitated renewable financing and âgreenâ bonds worth £27.3 billion.
Green bonds are issued in to finance solutions to address climate change as the proceeds shall go to green assets. These bonds can be issued by the government, financial institutions or corporations. The bank claims that this targeting by the forum is unfair, and it saw protests in its branches.
Barclays is involved in coal or tar extraction projects involved in polluting the environment, as they require large amounts of energy. The bank will have to form a strategy to phase out the provision of financial services to energy groups that are not meeting Paris climate goals upon successful approval of AGM resolution by the shareholders of the company.
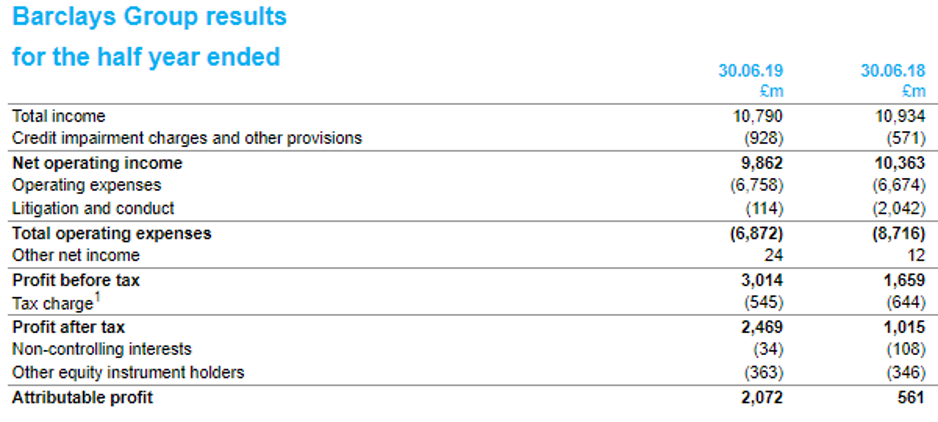
Barclays Plc -Business performance for H1 FY19 period ended 30th June 2019
 (Source: Companyâs filings, LSE)
By reducing costs, strengthening its capital base and reshaping its balance sheet, the company over the last few years has made great progress in simplifying its operations, which is expected to impact the financials in the coming future positively.
The groupâs total income declined by 1 per cent from £10,934 million in the prior year to £10,790 million during the reported period, while the net operating income plunged from £10,363 million reported in the previous year to £9,862 million during the period, as credit impairment charges went up from £571 million in the first half of 2018 to £928 million during the reported period.
Including litigation and conduct, the Groupâs Profit before taxation rose from £1,659 million in the first half of 2018 to £3,014 million during the period, while the Groupâs profit before taxation (excluding litigation and conduct) was down from £3,701 million in the first half of  2018 to £3,128 million during the period.
The bankâs profit in the UK (before taxation excluding litigation and conduct) was recorded at £1.1 billion during the period as against £1.2 billion in the first half of 2018, while the Groupâs statutory figure was reported at £1.1 billion during the period as against £0.8 billion in H1 FY18. Also, the company declared an interim dividend of 3 pence per share during the period.
Business overview: Barclays Plc
Barclays Plc (LON:BARC) is a banking and financial services company that operates across the globe. The company is engaged in the business of providing Retail, Corporate and Investment Banking services. Barclays Plc also engages in the provision of Portfolio and Wealth management services as well as Investment Management services to its High Net Worth Individual (HNWI) customers.
Barclays Plc-Stock price performance
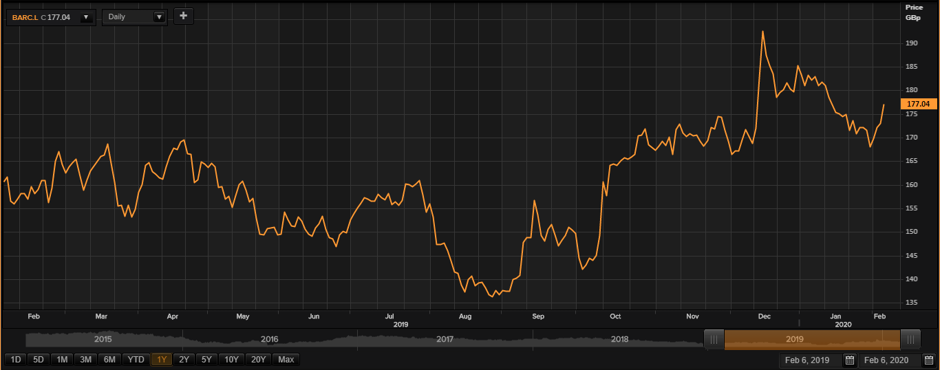
Daily Chart as at Feb-06-20, before the market close (Source: Thomson Reuters)
At the time of writing (before the market close, at 10:32 AM GMT), shares of the Barclays Plc were trading at GBX 177.04 and increased by 2.36 per cent against the previous day closing price. The shares of the company got admitted for trading on the Main Market of the London Stock Exchange on 01st November 1953. The total M-cap (market capitalisation) of the company stood at £30.03 billion, and its annual dividend yield stood at 4.05 per cent.
Daily Traded Volume Summary
The 5-day average daily traded shares, which exchanged hands were recorded at 30,345,794.80, which was approximately 0.078 per cent more than the 30-day average daily traded shares, which exchanged hands at the LSE (London Stock Exchange). At the time of writing, before the market close, todayâs traded volume of the shares of the company was around 9,858,848 and number of trades executed stood at 3,757 at the LSE (London Stock Exchange).
52-week High/Low range
In the past 52 weeks, shares of the Barclays Plc have hovered between a high price level of GBX 192.99 (as on 16th December 2019) and a low-price level of GBX 131.04 (as on 12th September 2019). At the current level of trading, as quoted in the price chart, shares traded around 8.26 per cent below the 52-week high and were 35.10 per cent above the 52-week low.
Price Performance (in percentage)
The shares of the Barclays Plc have delivered a positive price return of 7.75 per cent on a Year on Year (YoY) basis, much better compared to the benchmark index, as the benchmark index gave 3.36 per cent positive return over the same period. However, the stock has given a negative price return of approximately 3.72 per cent on a year-to-date (YTD) time frame and was down by approximately 5.64 per cent in the last one month.
Simple Moving Average (SMA)
From the Simple Moving Average standpoint, shares traded above the 200-day simple moving average price, while the shares traded below its 30-day and 60-day SMA prices.
Relative Strength Index (RSI)
The RSI indicator for the shares of the company for the 3-days, 9-days and 14-days was recorded at 70.91, 48.21 and 46.68, respectively. Also, the stockâs 30-days RSI was recorded at 49.55.
