


WM Morrison Supermarkets PLC
WM Morrison Supermarkets PLC (MRW) is a United Kingdom-headquartered company and is involved in the business of retail supermarket store and associated activities. The company is the 2nd largest food & drug retailer by market capitalisation in the United Kingdom market. Under its Morrisons brand, the company sells its product.
MRW-Financial Highlights for H1 FY2020
For the first half of 2020, the total revenue stood at £8.83 billion, an increase of 0.4 per cent from the corresponding period of the last year, including a contribution of 0.1 per cent (excluding fuel) from net new space. Total revenue, excluding fuel, increased by 0.3 per cent. Fuel sales surged by 0.6 per cent to £1.9 billion, with Like-for-Like (LFL) of 0.4 per cent. The companyâs LFL excluding fuel increased by 0.2 per cent, including wholesale surged by 1.3 per cent and retail decreased by 1.1 per cent. Operating profit before exceptional items rose by 2.4 per cent to £252 million, with the margin increasing by six basis points year on year to 2.9 per cent. The EBITDA margin before exceptional items stood at 5.8 per cent, an increase of 20 basis points year on year. Profit before tax and exceptional items climbed by 5.3 per cent to £198 million in H1 FY2020 (2018/19: £188 million). Statutory profit before tax after exceptional items increased by 48.5 per cent to £202 million in H1 FY20. EPS before exceptional items rose by 4.1 per cent to 6.38 pence as compared to the previous year (2018/19: 6.13 pence).
Cash capital expenditure stood at £212 million in the first half of 2020 (2018/19: £185 million). In H1 FY20, free cash flow increased by £15 million to £244 million. The companyâs net debt stood at £2,358 million in H1 FY20 (2018/19: £2,394 million). On a pre-IFRS 16 basis, net debt stood at £975 million, a decrease of £22 million from the end of 2018/19. Return on capital employed (ROCE) surged by 20 basis points from the 2018/19 year-end to 7.1 per cent and an increase from 7.0 per cent for the first half of 2019. The Board proposed an ordinary interim dividend per share of 1.93 pence. The interim dividend surged by 2.1 per cent to 3.93 pence per share in H1 FY20.Â
MRW-Share price performance
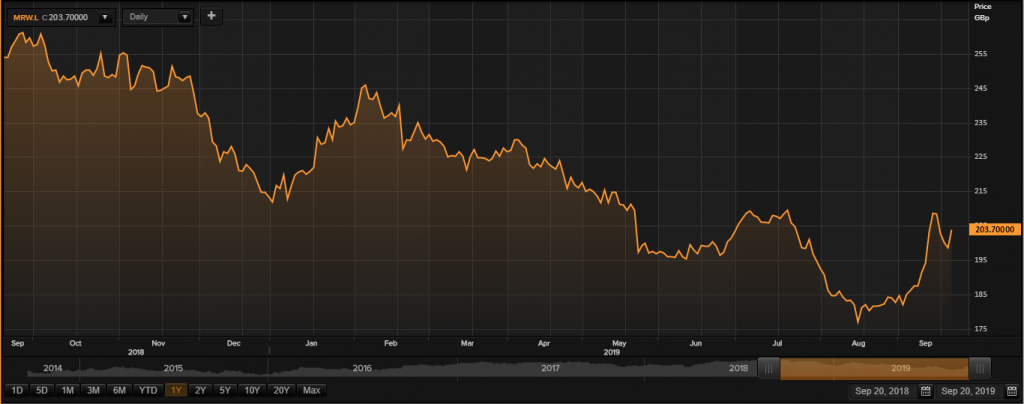
Daily Chart as on 20-September-19, before the market close (Source: Thomson Reuters)
At the time of writing, on 20th September 2019, (before the market close, at 09.45 am GMT), WM Morrison Supermarkets PLC shares were clocking a CMP of GBX 203.70. Fifty-two weeks High/Low of the stock is GBX 259.95/GBX 176.90. Stockâs average traded volume for 5 days was 12,527,120.60; 30 days â 9,001,806.90 and 90 days â 9,266,793.99. The traded volume (average) for 5 days surged by 39.16 per cent in comparison to traded volume (average) of 30 days. The companyâs stock beta was 0.75, which meant lower volatility as compared with the benchmark index. WM Morrison Supermarkets PLCâs market capitalisation was around £4.74 billion at the time of writing.
Whitbread PLC
Whitbread PLC (WTB) is a Dunstable, United Kingdom-headquartered multinational hotel and restaurant with Premier Inn hotel chain among its portfolio. The company also operates restaurant brands, Brewers Fayre, Bar +Block, Beefeater and Table. The company is planning to grow its Premier Inn brand in Germany and will open more than 30 hotels by 2020/21. Â Across the UK, the company operates more than 72,000 rooms across 785 hotels.
WTB-Trading Update for Q1 FY20
In the first quarter of FY 2020, the company reported that due to weak trading conditions, UK total accommodation sales declined by 1.5%, while UK like-for-like sales declined by 4.6%. Food and beverage sales in the UK declined by 0.4%, while like-for-like sales decreased by 2.1%. The group also reported that another year of high industry cost inflation is being offset by the efficiency programme undertaken by the group. Domestic hotel demand has been impacted by the ongoing political and economic uncertainty in the UK, which has led to weaker business and leisure confidence.
WTB-Financial Highlights for FY 2019
Driven by the contribution of new hotel additions in the current financial year, the companyâs reported revenue was up by 2.1 per cent to £2,049 million in FY19 from £2,007 million in FY2018. The underlying profit before tax was up by 1.2 per cent to £438 million in FY2019 from £432 million in FY2018, reflecting ongoing efficiency programme and lower underlying net finance costs. Driven by £178 million of non-underlying items, statutory profit before tax decreased by 39.1 per cent to £260 million. The statutory profit for the year (continuing and discontinued) stood at £3,731 million in FY2019 against £436 million in FY2018. The reported basic earnings per share (continuing and discontinued) stood at 2,040.8 pence in FY2019 against 239.7 pence in FY2018. The operating cash flow declined by 7.1 per cent in FY2019 to £814 million from £877 million in FY2018. In FY2019, the companyâs capex was up by £2 million to £557 million.
WTB-Share price performance
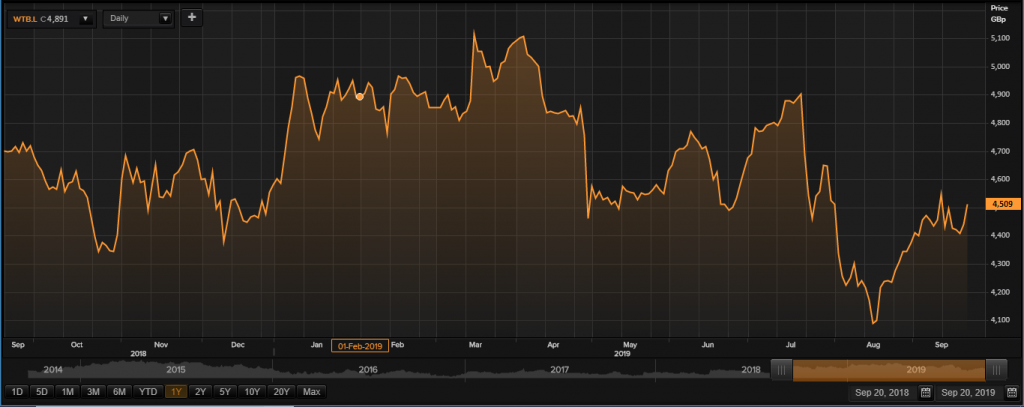
Daily Chart as on 20-September-19, before the market close (Source: Thomson Reuters)
At the time of writing, on 20th September 2019, (before the market close, at 09.49 am GMT), Whitbread PLC shares were clocking a CMP of GBX 4,509. Fifty-two weeks High/Low of the stock is GBX 5,162/GBX 4,055. Stockâs average traded volume for 5 days was 340,988.60; 30 days â 460,580.47and 90 days â 717,741.24. The traded volume (average) for 5 days plunged by 25.97 per cent in comparison to traded volume(average) of 30 days. The companyâs stock beta was 0.84, which meant lower volatility as compared with the benchmark index. Whitbread PLCâs market capitalisation was around £5.91 billion at the time of writing.
Sirius Minerals Plc
Sirius Minerals Plc (SXX) is a Scarborough, North Yorkshire-based fertiliser development company. The company is focused on the development and operation of its polyhalite project in North Yorkshire, which contains the largest, highest grade resource of polyhalite, a unique multi-nutrient fertiliser. The companyâs POLY4, fertiliser product can help in the production and quality of a varied crops to overcome concerns such as food security and rise in populations. The company is currently having an employee base of over 900 people.
SXX-Financial highlights for H1 FY19
On 17th September 2019, the company declared half-yearly results for the period ended 30th June 2019. The companyâs operating loss was recorded at £14.3 million in H1 FY19 as against £10.8 million in H1 FY18. The company deployed funds to the tune of £240 million on the development of the project. The companyâs cash and cash equivalents were recorded at £349 million in H1 FY19. The company has made significant progress across the construction sites, which are in line with FY19 guidance.
SXX-Share price performance
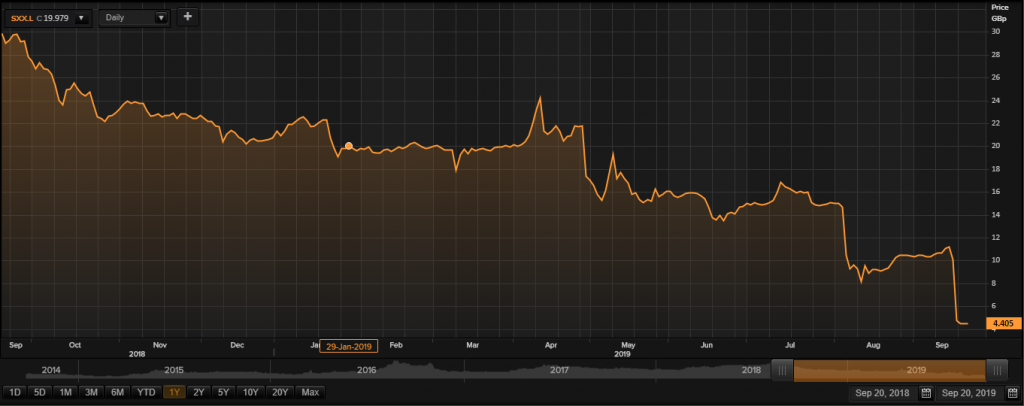
Daily Chart as on 20-September-19, before the market close (Source: Thomson Reuters)
At the time of writing, on 20th September 2019, (before the market close, at 09.55 am GMT), Sirius Minerals Plc shares were clocking a CMP of GBX 4.40. Fifty-two weeks High/Low of the stock is GBX 30.51/GBX 2.10. Stockâs average traded volume for 5 days was 176,209,745.00; 30 days â 61,556,867.87 and 90 days â 47,889,355.24. The traded volume (average) for 5 days surged by 186.26 per cent in comparison to traded volume (average) of 30 days. The companyâs stock beta was 1.90, which meant higher volatility as compared with the benchmark index. Sirius Minerals Plcâs market capitalisation was around £308.57 million at the time of writing.
Gulf Keystone Petroleum Ltd
Gulf Keystone Petroleum Ltd (GKP) is a holding company, which operates in the Kurdistan Region of Iraq and is engaged in oil and gas exploration and production. The company is based in Hamilton, Bermuda and is listed on the London Stock Exchange.
GKP-Financial highlights for H1 FY19
The companyâs revenue was recorded at $95.6 million in H1 FY19 as against $116.2 million in H1 FY18. The companyâs EBITDA stood at $59.0 million in H1 FY19 as against $61.6 million in H1 FY18. The companyâs profit after taxation stood at $24.2 million in H1 FY19 as against $26.7 million in H1 FY18. Cash balances of the company stood at $302.7 million as at 30th June 2019.
GKP-Share price performance
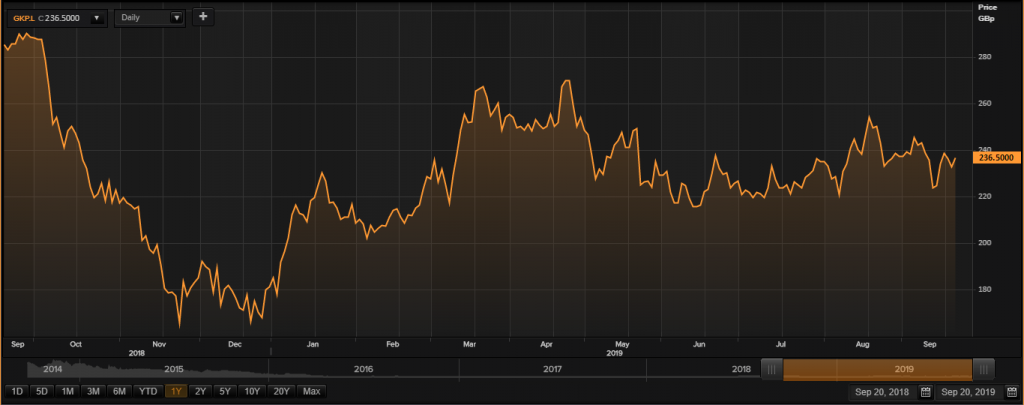
Daily Chart as on 20-September-19, before the market close (Source: Thomson Reuters)
At the time of writing, on 20th September 2019, (before the market close, at 10.02 am GMT), Gulf Keystone Petroleum Ltd shares were clocking a CMP of GBX 236.50. Fifty-two weeks High/Low of the stock are GBX 294/GBX164.75. Stockâs average traded volume for 5 days was 1,127,937.40; 30 days â 775,965.67 and 90 days â 669,262.04. The traded volume (average) for 5 days surged by 45.36 per cent in comparison to traded volume(average) of 30 days. The companyâs stock beta was 1.26, which meant higher volatility as compared with the benchmark index. Gulf Keystone Petroleum Ltd market capitalisation was around £516.35 million at the time of writing.
