


_07_03_2026_03_50_21_133108.jpg)

IQE PLCÂ
IQE PLC is a United Kingdom-based (Cardiff) designer & manufacturer of advanced semiconductor wafer products. The company is regarded as a leading global supplier of advanced wafer products and wafer services, providing a world-class platform with a global footprint spanning Europe, Asia and the USA. The companyâs products are used for a wide range of high-tech applications, catering to a diverse range of markets including LEDs and advanced electronics, power switching, CPV (advanced solar), InfraRed, photonics, and wireless. The groupâs operations are differentiated in four operating segments: Wireless, Photonics, Infra-red and CMOS.
Recent News
The company commenced production of VCSEL (Vertical Cavity Surface Emitting Lasers) output at the Newport Mega Foundry for a second major customer. The foundry data suggests that previous performances have improved with new qualification levels being attained. Therefore, the company has renewed its existing contract with the customer (valid until 2021). Furthermore, some potential contracts are worked upon and are in the final stages.
VCSEL is one of the main components used in 3D sensor systems, which uses light (structured) and ToF (Time of Flight) technologies. Its application includes facial identification, sensors used in the automobile industry, range-detection, motion- detection for both industrial and commercial use. This wide area of application creates huge potential, which makes the company invest heavily in building its mega foundry (Epi-wafer, Newport).
Trading update for H1 FY19
The company expects the revenue to be in the range of £65 million - £68 million in H1 FY19 (consensus £68 million). As previously expected, this period (H1 FY19) has been under pressure due to a lean smartphone market, specifically the Wireless Business Unit. Furthermore, the group has observed lesser revenues (Indium Phosphide laser) due to a customer-specific issue outside of IQEâs control (the datacom market).
The production unit at the Taiwan facility has been recognised by new standards, and revenue streams are generated which can cater to different customers and can partially offset the reduction in revenues discussed above.
In a rough market scenario, which is prevailing and is expected to continue in the near term, the company expects to generate revenue in the range of £140 million-£160 million in FY19 considering prevailing exchange rates.
Financial Highlights - Financial Year 2018 (£, million)
Total revenue over the year increased to £156.3 million, rising by 1.1 per cent as compared to FY17, while wafer revenue stood at £156.3 million, up by 2.4 per cent. Profits and margins were adversely affected due to a higher proportion of lower wireless revenue margin, production inefficiencies resulting from lower VCSEL production volumes, currency headwinds, among other factors. Gross profit declined from £38.8 million in FY17 to £37.5 million in FY18, while gross profit (adjusted) decreased from £43.8 million to £36.8 million in FY18. Adjusted operating profit decreased from £26.5 million in FY17 to £16.0 million in FY18. The companyâs PBT stood at £6,747 thousand for FY18 as against £15,095 thousand in FY17. In FY18, there had been a significant increase in the income tax by £5,123 thousand to £5,558 thousand from £435 thousand in FY17. The companyâs profit stood at £1,189 thousand in FY18 against £14,660 thousand in FY17. The basic earnings per share stood at 0.13 pence in FY18 versus 2.11 pence in FY17.
The company had a disappointing result in FY18 due to a weaker market. However, the company remains in a decent position and prospects of IQE are still strong. The company is expecting its segments to do well in H2 FY19 and in FY20. The company is planning for capacity expansion and shall commence production at the Epi-foundry in Newport (United Kingdom) in H1 FY19. The adoption of 3D sensing VCSELs and anticipated 5G technology deployments would be the key drivers for the growth for the company.
 IQE PLC Share price performance
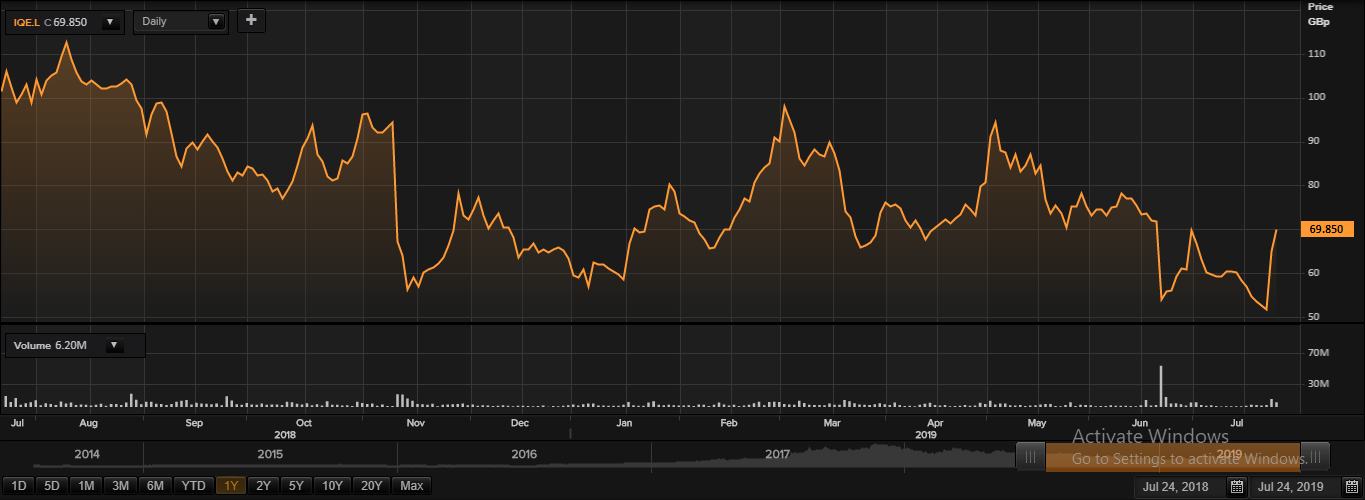
Daily Chart as at July-24-19, before the market close (Source: Thomson Reuters)
At the time of writing (as on July 24, 2019, at 01:48 PM GMT), shares of IQE PLC were quoting at GBX 69.85 per share; up by 7.79 per cent against the yesterday's closing price level. The companyâs market capitalisation (outstanding) stood at £514.33 million.
In the last 52-weeks, shares of IQE PLC have registered a high of GBX 114.50 (as on Aug 09, 2018) and a low of GBX 41.32 (as on Jun 21, 2019). At the current trading level, as quoted in the price chart, its shares were trading 38.99 per cent below the 52-week high price level and 69.04 per cent above the 52-week low price level.
The stockâs volume (before the market close, at the time of writing) stood at 6,205,228. Stock's average traded volume for 5 days was 4,016,197.80; 30 days- 4,818,883.97 and 90 days â 3,607,718.48.
The average traded volume for 5 days plunged by 16.66 per cent as against 30 days average traded volume. The companyâs stock beta was 0.37, which means it is less volatile as compared to the benchmark index.
The shares of the company (at the time of writing) were trading below the 60-days and 200-days SMA, which shows a negative trend in the stock price movement.
In the past 1 year, shares of IQE PLC have delivered a negative price return of 36.09 per cent. Also, on a year-to-date basis, the stock was down by approximately 0.31 per cent and plunged by 10.44 per cent in the past three months.
Share's RSI for the 30-days, 14-days and 9-days stood at 48.82, 55.00 and 62.76 respectively. Also, the stockâs 3-days RSI stood at 85.92. The volatility of the stock for 200 Days, 90 Days, 30 Days stood at 84.55, 87.26 and 120.95 respectively.
Â
Mporium Group PLCÂ
Mporium Group plc is a technology firm focused on capturing events to facilitate digital marketing. The companyâs forte lies in identifying moments and enabling advertisers to leverage on these moments to target potential customers. The company provides software to find insights about consumer behaviour. This can greatly help the advertisers in e-commerce analytics, customer segmentation, real-time customer data and trend patterns.
Changes in Board
Tom Smith would be a succeeding Nelius De Groot, who is currently serving as a CEO (Chief Executive Officer) in the company. Tom Smith shall immediately take over the responsibilities from Groot. However, Groot will be serving the company till August 2019 as a Non-Executive Director. Tom was previously taking control of the strategy and operations of the company.
Charles Pendred has been appointed as Non-Executive Chairman (Independent) of the group with immediate effect. He has 35 plus years of experience in capital markets.
Financial highlights for FY18
The companyâs revenue stood at £911,263 in FY18 as against £1,977,799 in FY17. The companyâs gross profit stood at £839,610 in FY18 as against £1,822,531 in FY17. The companyâs total loss stood at £7,037,516 in FY18 as against a loss of £3,170,054 in FY17. The companyâs cash balances stood at £904,396 in FY18 as against £1,586,773. The companyâs net assets stood at £876,576 in FY18 as against £4,535,746 in FY17.Â
Â
Mporium Group plc Share price performance
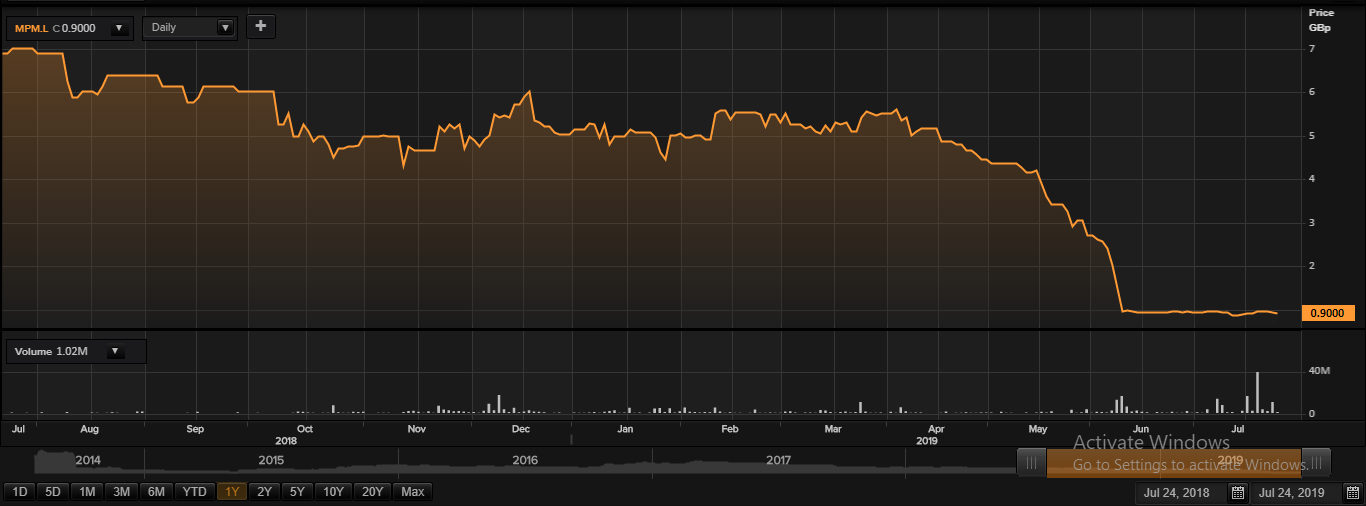
Daily Chart as at July-24-19, before the market close (Source: Thomson Reuters)
At the time of writing (as on July 24, 2019, at 02:05 PM GMT), shares of Mporium Group plc were quoting at GBX 0.90 per share; down by 1.63 per cent against the yesterday's closing price level. The companyâs market capitalisation (outstanding) stood at £9.52 million.
In the last 52-weeks, shares of Mporium Group plc have registered a high of GBX 7.05 (as on Jul 30, 2018) and a low of GBX 0.81 (as on Jul 23, 2019). At the current trading level, as quoted in the price chart, its shares were trading 87.23 per cent below the 52-week high price level and 11.11 per cent above the 52-week low price level.
The stockâs volume (before the market close, at the time of writing) stood at 1,020,823. Stock's average traded volume for 5 days was 11,314,641.00; 30 days- 3,976,828.07 and 90 days â 2,266,633.46.
The average traded volume for 5 days surged by 184.51 per cent as against 30 days average traded volume. The companyâs stock beta was 0.97, which means it almost follows the benchmark index.
The shares of the company (at the time of writing) were trading below the 60-days and 200-days SMA, which shows a negative trend in the stock price movement and could further move down from the current trading levels.
In the past 1 year, shares of Mporium Group plc have delivered a negative price return of 86.69 per cent. Also, on a year-to-date basis, the stock was down by approximately 81.79 per cent and plunged by 80.94 per cent in the past three months.
Share's RSI for the 30-days, 14-days and 9-days stood at 18.62, 22.71 and 35.37 respectively. Also, the stockâs 3-days RSI stood at 37.76. The volatility of the stock for 200 Days, 90 Days, 30 Days stood at 85.32, 102.47 and 35.70 respectively.
