


Summary
- Several healthcare stocks rallied on Tuesday morning as soon as the Canadian markets opened after a three-day long weekend.
- US stocks Johnson & Johnson (NYSE:JNJ or JNJ:US) and Medigus Ltd (NASDAQ: MDGS or MDGS:US) were among the most active stocks.
- Canadian stocks CloudMD (TSXV:DOC) and WELL Health Technologies Corp (TSX:WELL) also trended in the equity markets.
Healthcare stocks rallied on Tuesday morning as soon as the markets opened after a long Thanksgiving weekend. The TSX healthcare index was up by 35 points or 0.67 per cent at the time of filling this report. Canadian stocks CloudMD (TSXV:DOC) and WELL Health Technologies Corp (TSX:WELL) trended in the equity markets. US stocks Johnson & Johnson (NYSE:JNJ or JNJ:US), Medigus Ltd (NASDAQ: MDGS or MDGS:US) and Auris Medical Holding Ltd (NASDAQ: EARS or EARS:US) were also actively sought out by investors.
The surge in health stocks was primarily led by Johnson & Johnson, which released its third quarter financial results. The company posted a 102 per cent increase in net earnings, up from US$1.75 billion in third quarter 2019 to US$ 3.5 billion in third quarter 2020.
The development came amid reports of Johnson & Johnson halting its Covid-19 vaccine trials. The company’s advanced stage vaccine study was put on hold on Monday following “unexplained illness” in a participant. AstraZeneca and Oxford University’s vaccine testing is already on hold in the US as authorities investigate if it poses any risk.
Medigus Ltd (NASDAQ: MDGS or MDGS: US)
Current MDGS Stock Price: US$ 3.45
The Israel-based medical device company’s stocks surged on Tuesday morning after it announced the completion of Amazon's required regulatory processes. This allows Medigus to launch stores in five European Union nations – the UK, France, Italy, Spain and Germany.
Medigus was apprised of the development by Smart Repair Pro, a data-based tech firm that operates on the Amazon Marketplace. The company announced its foray into the e-commerce business last week after acquiring controlling stakes in Smart Repair Pro, Inc. and fume extraction firm Purex, Inc.
Medigus stocks have surged nearly 100 per cent this year. In the last three months, the scrip has advanced by almost 120 per cent.
The company develops equipment for minimally invasive medical procedures such as surgical endostaplers and direct vision systems. Its key product is Medigus Ultrasonic Surgical Endostapler (MUSE).
In its six-month financial results ending 30 June 2019, revenues of Medigus dropped by 49 per cent year-over-year to US$ 73,000. It posted non-IFRS loss of US$ 2.9 million, as compared to non-IFRS loss of US$ 1.64 million for the six months ended June 30, 2019.
The company’s current market cap is nearly C$ 30 million and its price-to-book ratio is 2.719, as per data on the TMX website.
Johnson & Johnson (NYSE: JNJ or JNJ: US)
Current Stock Price: US$ 148.45
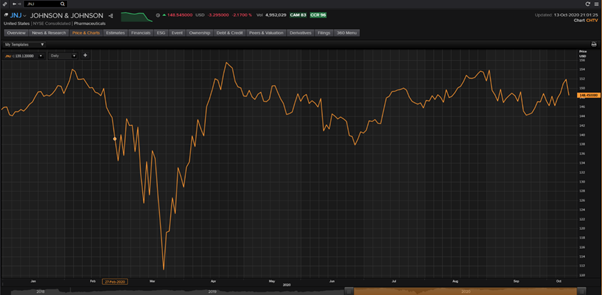
Johnson & Johnson Stock YTD performance/ Source: EODHD/Others, Thomson Reuters
Johnson & Johnson stocks traded in red on Tuesday morning after the company informed it had paused its COVID-19 vaccine trials due to an unexplained illness in a study volunteer.
However, it was among the most active stocks after reporting 1.7 per cent increase in third quarter sales due to high demand for its cancer drugs.
The company’s total sales amounted to US$ 21.1 billion in the latest quarter, driven by a rise in consumer segment in the US markets. Sales of over-the-counter products such as TYLENOL analgesics, digestive health drugs, LISTERINE mouthwash, OGX skin products and BAND-AID bandages grew.
J&J’s adjusted operational sales recorded a 2 per cent rise despite the adverse impact of the pandemic. The company reported earnings per share (EPS) of US$ 1.33, a massive growth of 101.5 per cent in Q3 2020 compared to US$ 0.6 in Q3 2019. The company distributed US$ 1.01 quarterly dividend.
Since the COVID-19-led market crash in March this year, the JNJ stock price has increased by 33.7 per cent. It has surged nearly 1.8 per cent YTD.
Johnson & Johnson’s current market cap is C$ 392.44 billion. Its current price-to-book ratio is 6.232, price-to-earnings ratio is 26.50 and price-to-cash flow ratio is 19.4, as per data on the TMX portal.
The company’s debt-to-equity ratio is 0.48. It has posted a positive return on equity and return on assets of 24.54 per cent and 9.69 per cent, respectively. Its current dividend yield is 2.7 per cent.
