


Summary
- Cenovus delivered strong financial results after acquiring Husky Energy on January 1, 2021.
- The energy company increased its upstream production to 769,254 barrels of oil equivalent per day (boepd) from 482,594 boepd in March 2020.
- The CVE stock has swelled by 106 per cent in the past six months.
Cenovus Energy Inc. (TSX:CVE) delivered strong financial results in its inaugural quarter of 2021 after it acquired Husky Energy Inc. (TSX:HSE) on January 1, 2021. The company posted net earnings of C$ 220 million compared against a net loss of C$ 1.8 billion in the first quarter of 2020.
The energy company said that its methodical approach in integrating Husky's assets helped the company to rebound and deliver strong financial results.
Cenovus' profit amounted to C$ 0.10 per share in Q1 2021, compared with a loss of C$ 1.46 apiece in the same quarter of the previous year.
On the operational front, the company increased its upstream production to 769,254 barrels of oil equivalent per day (boepd) from 482,594 boepd in March 2020. The downstream production increased to 469,100 barrels per day.

©Kalkine Group 2021
Since the company has delivered strong financial results, let's explore the company further and it might help you gain insight about an energy stock if you're looking to diversify your investment portfolio:
A Look At Cenovus' (TSX:CVE) Stock
Cenovus Energy (TSX:CVE) distributes a quarterly dividend of C$ 0.018 and its current dividend yield is 0.72 per cent. Its market cap is C$ 19.5 billion and holds a debt-to-equity (D/E) ratio of 0.56.
On March 11, 2021, the CVE stock touched a 52-week high of C$ 10.77, and it closed at C$ 9.63 on Thursday, May 6. On an average, over 3.4 million shares of the company were traded in the past 90 days. The stock has advanced by 18.5 per cent in three months.
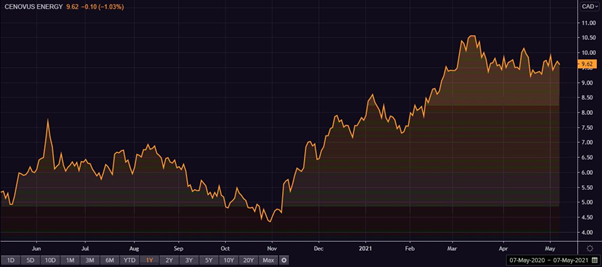
One-year chart of stock performance of Cenovus (Source: EODHD/Others/Thomson Reuters)
The stock swelled by 106 per cent in the past six months. It grew by 24 per cent year-to-date (YTD) to beat the S&P TSX Integrated Oil & Gas (Sub Industry) Index, which declined by 5.4 per cent in the same period.
Financial Highlights of Cenovus Energy
In Q1 2021, the company's revenue totalled C$ 9.15 billion, an increase of C$ 5.19 billion in the same quarter of 2020. From C$ 160 million in Q1 2020, the cash and cash equivalents increased to C$ 873 million.
The adjusted EBITDA was C$ 2.6 billion in this year's first quarter, up from C$ 606 million in the previous quarter ended December 31, 2020. The cash from operating activities was C$ 228 million, an increase of 82 per cent year-over-year (YoY).
The above constitutes a preliminary view and any interest in stocks should be evaluated further from an investment point of view.
