


On 27 August 2019, the benchmark index S&P/ASX 200 settled at 6,471.2, up 31.1 points by 0.48% from its last close. On the same day, S&P/ASX 200 Resources closed trading at 4,469.3, up 0.04%. In this article, we would be discussing two stocks from resources space that have updated the market with their performance during the year - FY19. Letâs have a look at Beach Energy Limited and Evolution Mining Limited.
Beach Energy Limited
Beach Energy Limited (ASX: BPT) is primarily engaged in the exploration and production activities, focussed on oil and gas. Recently, upstream oil and gas explorer and producer, Cooper Energy Limited (ASX:COE) updated the market regarding the successful completion of a three-well appraisal program at the Parsons oil field in Cooper Basin, South Australia by the PEL 92 Joint Venture, in which COE has a stake of 25%, while the remaining 75% is held by the operator, Beach Energy.
FY19 Results:
On 19th August 2019, the company unveiled its FY19 results. In FY19, the company achieved record production of 29.4 MMboe, which was around 55% higher than the production achieved in FY18. The total production in FY19 was even ahead of the companyâs initial FY19 guidance range of 26 â 28 MMboe. During the year, the companyâs drilling team oversaw the drilling of 134 wells in FY19, representing an increase of 40% when compared with the year-ago period, and at improved drill rates. The companyâs drilling success rate was 84% in FY19, which helped in driving an increase in production at the Cooper Basin. Moreover, 2P reserves increased from 313 MMboe in FY18 to 326 MMboe in FY19.
Financial Strength and Disciple Maintained in FY19:
For FY19, Beach Energy reported an underlying NPAT of $560 million, up 86% on pcp, driven by a 55% increase in sales volumes and higher realised Australian dollar oil and gas prices. Further, the company reported an underlying EBITDA of $1,375 million, up 80% on FY18. For FY19, the company reported ROCE (Return on Capital Employed) of 27%, significantly higher when compared with the ROCE of 19% in FY18.
The companyâs FY19 financial performance was supported by strong operational performance across the business.
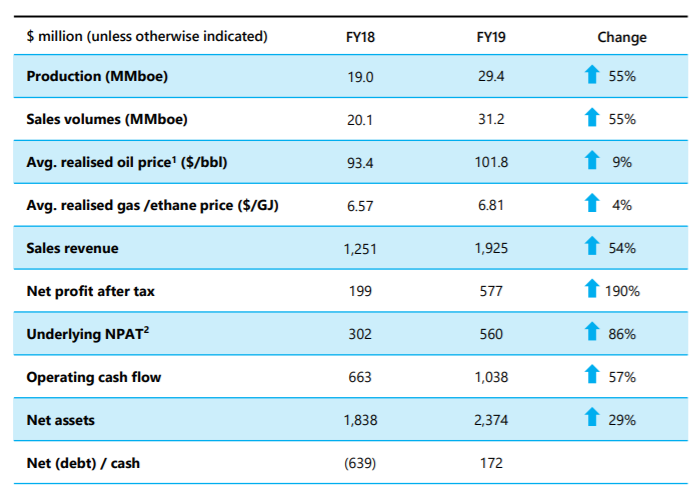
Financial Year 2019 Results Snapshot (Source: Company Reports)
At the end of FY19, the company had a free cash flow of $559 million, underpinning $950 million of debt repayments. With this, the company has put its balance sheet in a net cash position. As at 30th June 2019, the company had total liquidity of $622 million and a cash balance of $171.9 million.
During the year, the company also met its $60 million synergy target. The company is now on track to achieve a 20% reduction in direct controllable operating costs by the end of FY2020. During the year, the company made record investment in the Beach business with capital expenditure of $447 million. The company has announced a 100% franked final dividend of 1 cent per share for FY19, scheduled for payment from the profit distribution reserve.
Outlook:
The company is now planning to accelerate investment in its expanded growth portfolio. It is targeting 34â40MMboe annual production in the medium term and cumulative free cash flow of over $2.7 billion over the next 5 years.
In FY20, the company is expecting its production to be in the range of 27 â 29 MMboe and its capital expenditure to be $750 â 850 million. The company expects its underlying EBITDA to be in between $1.25 â 1.40 billion in FY20.
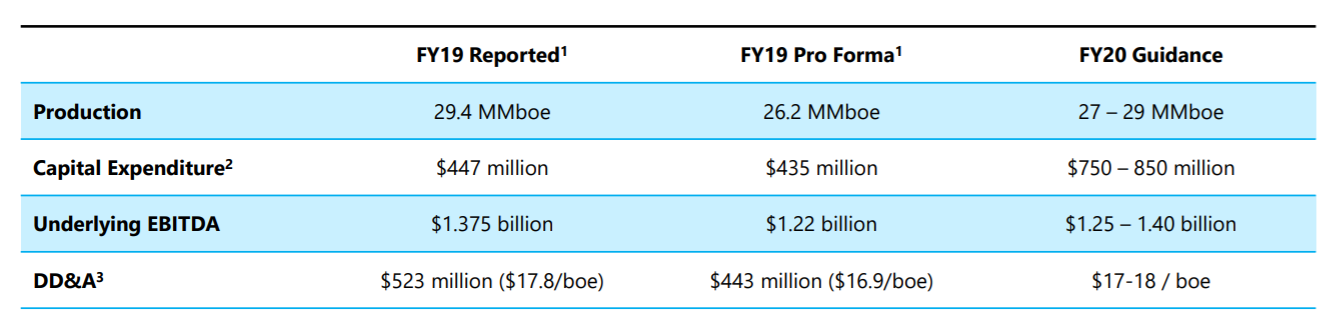
FY2020 Guidance (Source: Company Reports)
Stock Performance:
BPTâs stock has delivered a return of 13.25% and 6.86% during the last three and six months, respectively as on 27 August 2019. However, on a YTD basis, the stock has gained 68.99%. At market close on 27 August 2019, BPT last traded at a price of $2.240, up 2.752%, with a market capitalisation of circa $4.97 billion. Currently, the stock is available at a price to earnings multiple of 8.600x.
Evolution Mining Limited
Evolution Mining Limited (ASX: EVN) is primarily involved in the exploration and production of gold. The company has announced a dividend of AUD 0.06 per security (100% franked), which would be paid on 27 September 2019.
FY19 Results:
The company recently announced its full year FY19 results, wherein statutory net profit after tax stood at A$218.2 million as compared with A$263.4 million in FY18. Underlying NPAT of A$218.2 million was below ~A$251 million recorded by the company in the previous year. Sales revenue for the period came in at A$1,509.8 million as compared with ~A$1,540.4 million in FY18. The year saw gold production of 753,001 ounces, representing eighth consecutive year of meeting production guidance. The balance sheet saw a reduction in debt from banks to A$300.0 million during FY19 from A$395 million at the end of 30 June 2018. Group EBITDA margin remained healthy for FY19, reaching 48% with an average of 50% for the last three years.
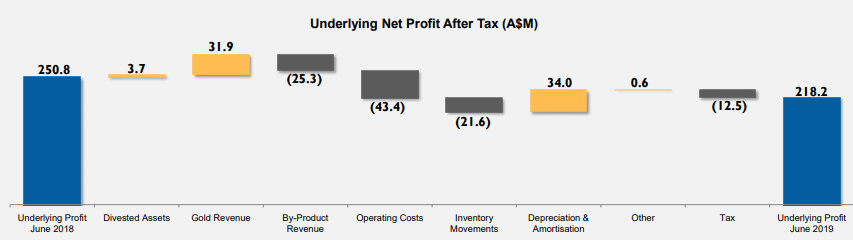
Underlying Net Profit for FY19 (Source: Company Reports)
3 Out of 6 Operations Exceeded Guidance in FY19:
The FY19 total production of 753,001 ounces was well within the guidance of 720,000 â 770,000 oz. The production from Cowal, Mt Carlton and Ernest Henry, all surpassed the top end of production guidance. The company reported mine operating cash flow of A$771.4 million and net mine cash flow of A$497.8 million, as all operations delivered positive cash flow generation after meeting their operating and capital needs. From Ernest Henry operations, the company reported a record net mine cash flow of A$222.2 million for FY19. In FY19, the company achieved the AISC of A$924 per ounce.
FY20 Guidance:
In the financial year 2020, Evolution Mining is expecting its gold production in the range of 725k â 775k ounces. Meanwhile, AISC is anticipated to come in between A$890 â A$940 (each ounce). The company expects its exploration investment in FY2020 to be in the range of A$80.0 â A$105.0 million. This is primarily due to the success at Cowal operations. Cowal is expected to receive the largest chunk of the discovery investment allocated for the financial year 2020.
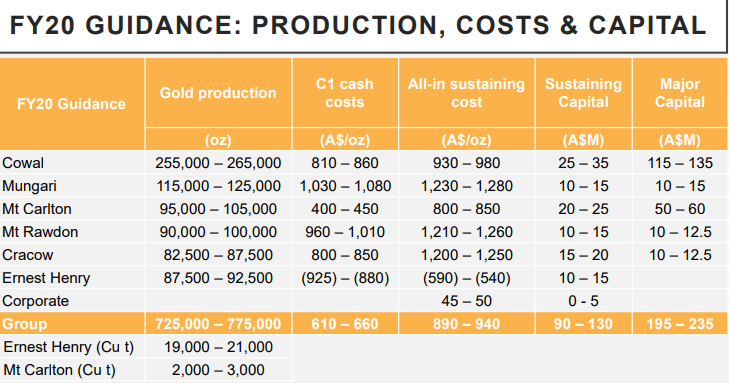
Source: Companyâs Report
Highlights for June Quarter:
For the June quarter 2019, the company reported mine operating cash flow of $215.2 million, up $46.9 (28%) million on the previous quarter. As a consequence, the net cash position at the end of the June quarter increased to A$35.2 million. Further, the company reported net mine cash flow of A$152.2 million, which was around $44.4 million (41%) higher than the previous quarter.
At Cowal, during the June quarter, the company conducted work across three prospects; GRE46, East Girral, and Reflector. During the quarter, the company completed a total of 12,728 metres of diamond drilling and 6,740 metres of air core (AC) drilling. Along with this, the company also completed a ground gravity and 3D MIM Distributed Acquisition System (MIMDAS) induced polarisation (IP) surveys. The company has reported excellent drilling results at GRE46 and Dalwhinnie with significant intersections including: 20 metres (16 metres etw) grading 8.36 grams per tonne of gold and 22 metres (17.6 metres etw) grading 5.49 grams per tonne of gold.
At Mungari, the company completed a total of 21,001 metres of drilling across seven targets during the quarter. In total, the company completed the total drilling of 31,104 metres (resource definition) and 35,079 metres (discovery) during the quarter.
At its Drummond Project Joint Venture (earning 80%), a diamond drilling program, totalling 2,159 metres over five holes was completed. Notable intercepts received to date include:
- 0m (2.7m etw) grading 3.42g/t Au and 6.7g/t Ag from 7m (BHDD_003)
- including 1.0m (0.8m etw) at 9.16g/t Au and 18.1g/t Ag from 9m
Stock Performance:
In the past one-year time frame, EVNâs stock has provided a return of 92.42%. On 27 August 2019, the stock closed the dayâs trading at a price of $5.060, down 5.066% from its previous closing price. The stock is available at price to earnings multiple of 41.45x with a market capitalization of circa $9.07 billion and approximately 1.7 billion outstanding shares.
Disclaimer
This website is a service of Kalkine Media Pty. Ltd. A.C.N. 629 651 672. The website has been prepared for informational purposes only and is not intended to be used as a complete source of information on any particular company. Kalkine Media does not in any way endorse or recommend individuals, products or services that may be discussed on this site. Our publications are NOT a solicitation or recommendation to buy, sell or hold. We are neither licensed nor qualified to provide investment advice.
