


For the last 12 to 18 months, most of the commodity markets were plagued by the ongoing unresolved US-China trade tensions apart from the other geopolitical tension throughout the globe, and with the onset of the new year 2020, we have already seen the developments from both the sides to deescalate the current situation and the signing of phase 1 of the US-China trade deal. But the million-dollar question remains unanswered- "How will the commodity market shape up in 2020?"
The slowing global economy can also be expected to recover in 2020 with the help of US Fed and other central banks' cash policies. Can we expect a potential positive rebound in the first half of the year? For some commodities, the start of the year is an interesting and exciting time with a seasonal restart in winter, driven by the increased demand for the raw material of steel which also drives the Iron ore, Copper, nickel trades. A big upside is expected in the initial period as it is restocking period of these commodities.
Also, in the energy market, the OPEC nations and Russia came together announcing the production cuts by 500,000 barrels per day and holds power to restrict the supplies. The supply cuts will draw down the inventories and tighten up the market to support crude oil prices. The oil prices in 2020 could pose an inflation risk to almost all other the commodities. The higher input cost of the commodities would be controlled by the favourable price performance of Crude oil. One such commodity is Copper; we need to review the copper market which has received few positive signals with the onset of 2020.
Copper Making New Highs
Global Demand- EV a Catalyst?
For 2019, the world copper demand is estimated at 24 million tonnes, in line with 2018. China reduced the copper imports, which was compensated by the increase in refining capacity and consumed almost half of the World's refined Copper. The demand from the West (Europe & the US) stood stagnant.
China GDP growth rate @6.1% - The Sanguine annual growth rate of 6.1% is expected to fuel the copper demand in 2020, with expected investments in to the electric grid infrastructure. Higher demand is expected due to expansion in the copper refining capacity.
Electric Vehicles & Renewable Sectors: An increasing demand from electric vehicles and renewable sectors are also expected. As per the latest World Energy Outlook, the solar and wind energy is projected to double by the year 2025, and the electric vehicle sales is set to touch figures of 44 million units by the year 2030. Each electric vehicle on an average uses almost four times as much Copper as a conventional internal combustion engine vehicle and also similar demand can be expected from the charging infrastructure. The timing of the accelerated growth of electric vehicles still remains a concern. Interestingly, Wallstreet seems to believe EV is here to stay, as Tesla market cap is inching closer to over-take Volkswagen and secure the world’s biggest automobile company tag (market capitalisation basis).
The higher than expected growth rate signifies strong growth in the industrial activity in China and the consumption of Copper is estimated to exceed 25 million tonnes in 2021.
Emerging battery technologies in the era of electric mobility: Must Read
Global Supply- Labour Unrest Leads to Supply Crunch?
The output from mine production is projected at 21 million tonnes, constrained by outages and decline in ore grades. Also, increase in power costs and the amendment to the tax regimes are further pushing the mid to high cash cost copper producer towards the highest cash cost quartile on the cash cost curve.
Civil & Labor Protests
The civil unrest in Chile disrupted the copper supply from the World's largest copper supplier, Codelco. The production at the Andinas mining operations was halted while some of the operations such as Salvador mining and smelter complex operated at minimum levels. The civil and labour protests were not restricted to Chile but also took place at the Cobre Panama's newly commenced Tia Maria mine which impacted the ramp-up of the project. In India, Vedanta's 400 kilotonnes copper smelter was halted due to the protest from local communities on the alleged environmental violations by the company, the disruption in production cost roughly US$200 million to the company. Such protest is expected to continue in future, but better management of the situation is expected from the mining players to minimize risks to their business.
Declining Mill Head Grade
The lower mill head grades (MHG), heavy rains and protests at Chiquicamata further declined the copper output of Codelco, the world leader, is currently securing funds to fund its greenfield and brownfield projects of higher reserve grades and remains optimistic on the supply from Chile in future.
Greenfield and Brownfield Projects: Greenfield and brownfield projects are expected to come onstream with higher mill head grade to produce maximum Copper at minimal costs. Peru expects to increase its production in 2020 and 2021, accounting mainly to the capacity additions of Copper in the country. Example: Minera Chinalco expects to increase the capacity (45% increase) of its Toromocho operations to almost 300 kilotonnes of Copper by the end of the year.
Mine Transition & Ramp Up: Grasberg, one of the largest gold and copper mines, transitioned from open pit to underground operations in mid-2019, resulting in lower production volume in 2019, expects to ramp up its production in future. Further, refining capacity expansions in China and India are expected. China added almost 450 kilotonnes of refined copper capacity in 2020.
China accounts for around 40 per cent of refined world production, and 450,000 tonnes of new capacity came online in 2019. Refined Copper is estimated to exceed 25 million tonnes in 2021, mostly due to capacity additions in China but still remains contingent on the availability of concentrate supply, electricity costs and tightening environmental restrictions in future.
Price Outlook – Copper Trading Near 8 Month highs
Trade Deal
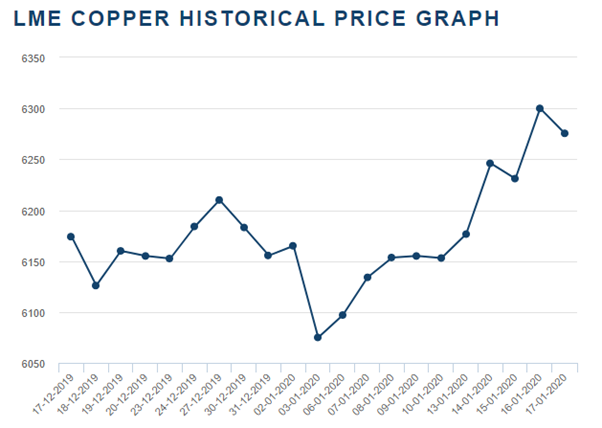
The signing of phase 1 of the US-China trade deal lead to a bull run in the commodities prices, however, a lot of uncertainty remains on the terms and output of the trade deal. Copper reached the level of 8 month high, as the investors cashed in on the opportunity. The copper spot prices exceeded the US$6,300 a tonne mark at the LME. US treasury secretary Steve Mnuchin said that the tariff on the Chinese goods would remain, but US President may consider easing on them after the signing of the second phase of the US-China trade deal. The signing of the trade deal would bring back the investors interest in the commodity.
Chile
Further, the labour issues being faced by Codelco could disrupt the supply from Chile, which accounts for almost 30% per cent of the global copper production. This might delay or even lead to the not signing of the supply contract of Codelco with its Chinese counterpart Shandong Fangyuan for the supply of copper concentrates.
Inventory Stocks
The LME warehouse inventory fell down to 132,725 tonnes from 342,000 tonnes in August 2019, the lowest in the six months further pushing the copper prices. The restocking of inventories is expected in the upcoming month, adding to the momentum of Copper demand. Recent healthy growth results from China indicates good demand from China in the near future.
Copper prices, in the midst of trade deal and strong Chinese growth, expects strong support from the industry. Further, capacity additions to the mine and refineries along with restocking demand of the inventories could provide initial thrust to the Copper demand.
