


In Australia, banks have been classified into four main sub-categories:
- Major banks: The four largest Australian banks are the Commonwealth Bank of Australia, Australia and New Zealand Banking Group Limited, the National Australia Bank Limited, Westpac Banking Corporation and their subsidiary banks;
- Other domestic banks: All locally owned banks excluding those classified as major banks (e.g. Bank of Queensland Limited, Macquarie Bank Limited);
- Foreign subsidiary banks: Foreign banks authorised to carry on banking business in Australia through a locally incorporated subsidiary (e.g. HSBC Bank Australia Limited, ING Bank (Australia) Limited);
- Foreign bank branches: Foreign banks licensed to conduct banking business in Australia through branches, subject to a condition which specifically restricts the acceptance of retail deposits (e.g. Citibank, N.A., Credit Suisse AG).
The major banks of Australia are also known as The Big Four Banks and they are the Commonwealth Bank of Australia (ASX:CBA), Australia and New Zealand Banking Group Limited (ASX:ANZ), the National Australia Bank Limited (ASX:NBA), Westpac Banking Corporation (ASX:WBC).
National Australia Bank Limited versus Commonwealth Bank of Australia
Today we will have a comparative study between the two banks based on different criteria.
Performance of NAB and CBA
The stock of NAB closed the day’s trading at $27.820 per share on 14th November 2019, down by 3.369% from its previous closing price. The company has a market capitalisation of $83 billion as on 14th November 2019. The total outstanding shares of the company stood at 2.88 billion, and its 52-week low and high is $22.520 and $30.000, respectively. The bank has given a total return of 4.09% and 13.21% in the time period of 3 months and 6 months, respectively.
The stock of CBA closed the day’s trading at $79.840 per share on 14th November 2019, up by 0.757% from its previous closing price. The company has a market capitalisation of $140.27 billion as on 14th November 2019. The total outstanding shares of the company stood at 1.77 billion, and its 52-week low and high is $67.550 and $83.990, respectively. The bank has given a total return of -0.28% and 7.81% in the time period of 3 months and 6 months, respectively.
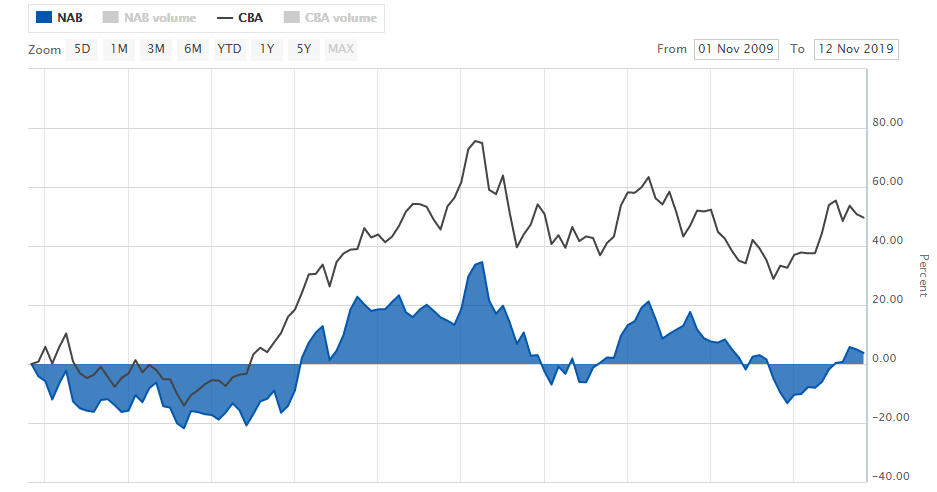
Comparative Price Chart of NAB and CBA (Source: ASX)
Based on market capitalization Commonwealth Bank of Australia is bigger than National Australia Bank Limited and if we look at the returns both the banks have generated in the past 10 years, CBA is far ahead of NAB.
Both the banks are considered to be good dividend paymasters and the dividend yield of both the banks is above 5%. The dividend yield of NAB stood at 5.77% and the dividend yield of CBA stood at 5.44%.
Financial Highlights of The Banks
National Australia Bank Limited
FY19 was a challenging year for NAB as its revenue was down by 4.2% However, revenue rose by 1.1% by excluding customer-related remediation, mainly reflected in the growth in business lending partly offset by lower margins. Net Interest Margins (NIMs) declined by 7 basis points (bps) to 1.78% However, by removing markets and treasury and customer-related remediation, NIMs declined by 4 bps with home lending competition being an important driver.
- The credit impairment charges increased by 18% to $919 million, and as a percentage of gross loans and acceptances rose 2 bps to 15 bps;
- The company reported Group Common Equity Tier 1 (CET1) ratio of 10.38% as on 30th September 2019, up 18 bps from that on 30th September 2018;
- The bank reported liquidity coverage ratio (LCR) quarterly average of 126%;
- And leverage ratio (APRA basis) of 5.5%.
The divisional performance of the bank:
- Business & Private Banking: Cash earnings decreased by 2.4% which mainly reflected higher credit impairment charges and higher investment spend and revenue increased 1% reflecting good SME business lending growth;
- Consumer Banking & Wealth: Banking earnings decreased by 11.2% due to lower margins with competitive pressures in housing a key driver, combined with increased credit impairment charges;
- Corporate & Institutional Banking: A lower result reflecting higher credit impairment charges relating to impairment of a small number of larger exposures and revenue increased 1% despite lower Markets income, with higher lending volumes benefitting from continued focus on growth segments;
- New Zealand Banking: Higher earnings with increased revenue benefitting from growth in lending, partly offset by increased investment spend and higher credit impairment charges.

Bank’s Financial Performance in mn (Source: Company Reports)
Commonwealth Bank of Australia
CBA remains well placed in a difficult operating environment, underpinned by global macroeconomic insecurity and historically low interest rates. Bank’s strong capital position and balance sheet are well positioned to cater to the needs of customers, demonstrated by good volume growth in core markets of home lending, business lending and household deposits.
- The bank reported unaudited statutory net profit of approximately $3.8 billion in 1Q FY 20, including a $1.5 billion gain on sale of CFSGAM;
- Unaudited cash net profit from continuing operations stood at approximately $2.3billion, up 5% excluding notable items;
- Operating income was up 3% on a day-weighted basis due to lower basis risk, one-off items and volume growth;
- Strong CET1 ratio of 10.6% after 2019 final dividend payments (-90 basis points) and organic generation of 35 basis points excluding one-offs;
- Operating expenses (ex-notable items) increased 2% due to higher staff costs and IT amortisation, partly offset by business simplification savings;
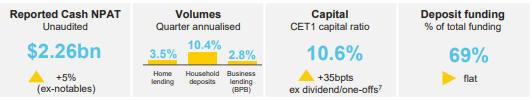
Q1FY20 Overview (Source: Company Reports)
What to Expect
Commonwealth Bank of Australia anticipates its operating context to remain challenging as it adapts to heightened regulatory change, increasing competition, evolving customer preferences, and need to invest in risk and compliance, and technology and innovation. It is focused on continuing to serve its customers’ needs and making the necessary changes to become a simpler and better bank.
National Australia Bank Limited stated that the Australian economic growth has slowed and is anticipated to remain below trend in 2020 and 2021, while New Zealand growth has slowed to a modest level. The bank is now over two years into its three-year transformation. NAB's $1.5 billion targeted additional investment over three years is delivering better outcomes for all its stakeholders.
Conclusion
In the above article we talked about how the banks have performed over the past period, their financial performance and their outlook. We are not picking either of the banks as the best as these two banks are considered among the Big Four Banks of Australia and they all are well-performing banks.
Disclaimer
This website is a service of Kalkine Media Pty. Ltd. A.C.N. 629 651 672. The website has been prepared for informational purposes only and is not intended to be used as a complete source of information on any particular company. Kalkine Media does not in any way endorse or recommend individuals, products or services that may be discussed on this site. Our publications are NOT a solicitation or recommendation to buy, sell or hold. We are neither licensed nor qualified to provide investment advice.
