


Spot gold rose from the level of US$ 1275.11 (Dayâs low on 30th May 2019) to the present level of US$ 1292.64 (as on 31st May 2019 AEST 4:16 PM).
After a recent tariff hike on US$ 200 billion worth of Chinese goods from 10 per cent to 25 per cent, the United States president Donald Trump moved ahead yesterday and mentioned that Washington would impose a 5 per cent tariff on Mexican goods.
In his tweet, the U.S. president mentioned and warned Mexico that the tariff hike would keep on increasing if the illegal migration from Mexico to the United States does not mark a hiatus.
The decision by the president came overnight, which in turn, raised further concerns in the global market that historical trade tariff war could retake its roots.
The stimulus of the full-fledged trade dispute of the United States against various economics exerted the pressure on dollar prices, and the market was quick to react to hedge against it, which in turn, provided an impetus to the gold prices in the international market.
The dollar index plunged from the level of 98.28 (Dayâs high on 30th May 2019) to the present level of 98.10 (as on 31st May 2019 AEST 4:25 PM), and the yield-to-maturity or the market discount rate dropped significantly from the level of 2.285% (Dayâs high on 30th May) to the present level of 2.177% (as on 31st May 2019 AEST 4:29 PM).
Further adding to the escalated situation, the former governor of the Peopleâs Bank of China- Dai Xianglong commented that there are oblique chances of any trade breakthrough at the upcoming G-20 summit.
Apart from the event-driven movement, gold prices moved in the green-zone amid deteriorating economic figures.
During the early morning today, the China Federation of Logistics & Purchasing released the manufacturing numbers for May 2019, which marked a decline below its mean value of 50, and the Manufacturing PMI stood at 49.4.
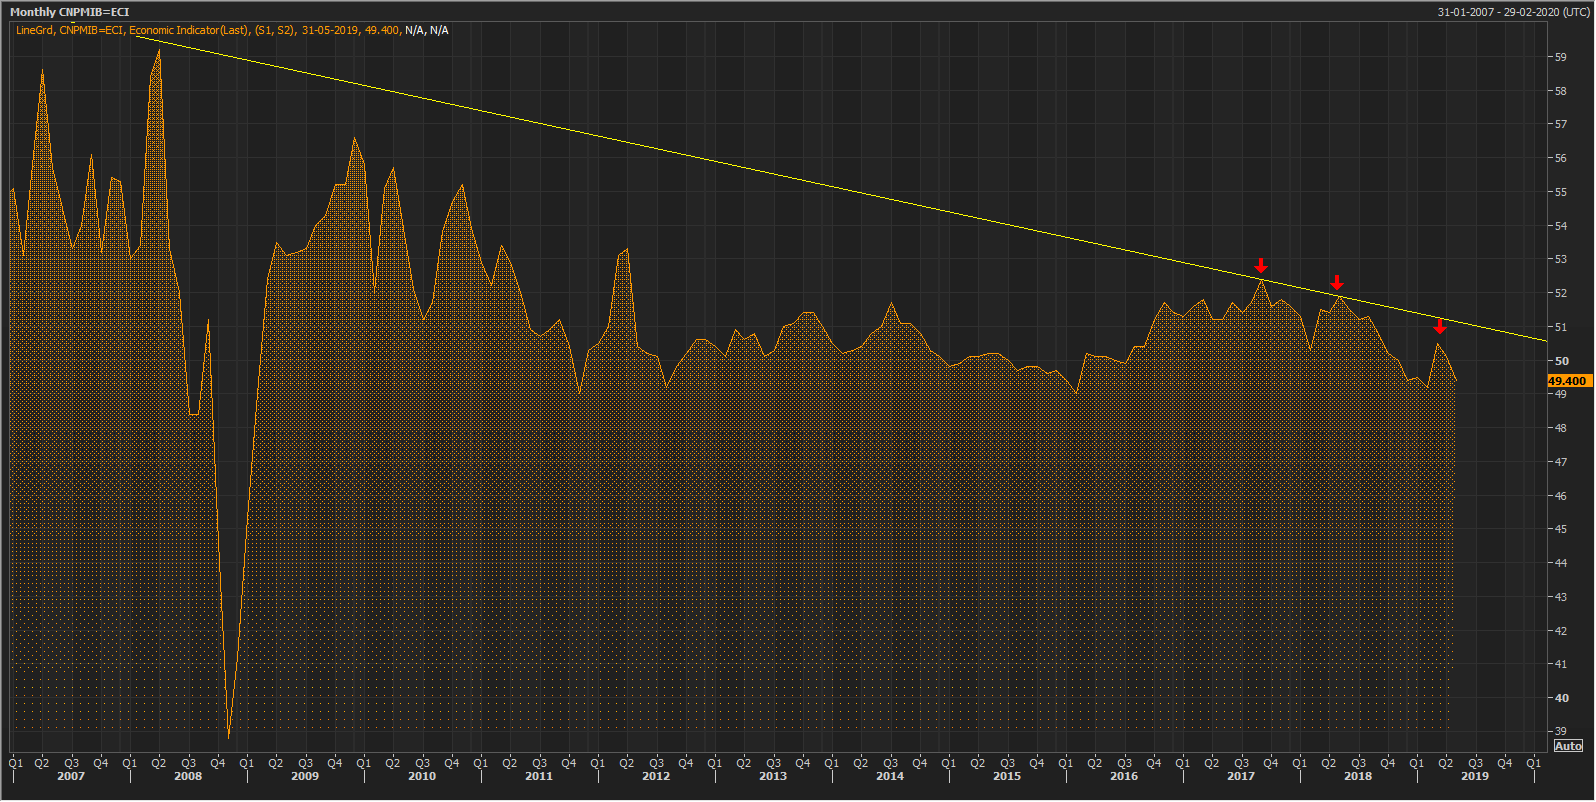 Â China Manufacturing PMI (Source: Thomson Reuters)
 China Manufacturing PMI (Source: Thomson Reuters)
As shown in the chart above, the PMI declined and took a hurdle of the downward sloping trendline, which in turn, further suggests that the manufacturing gradually weakened over time in China, which could be further related to the impact of the trade dispute of the country with the United States.
Gold on Charts:
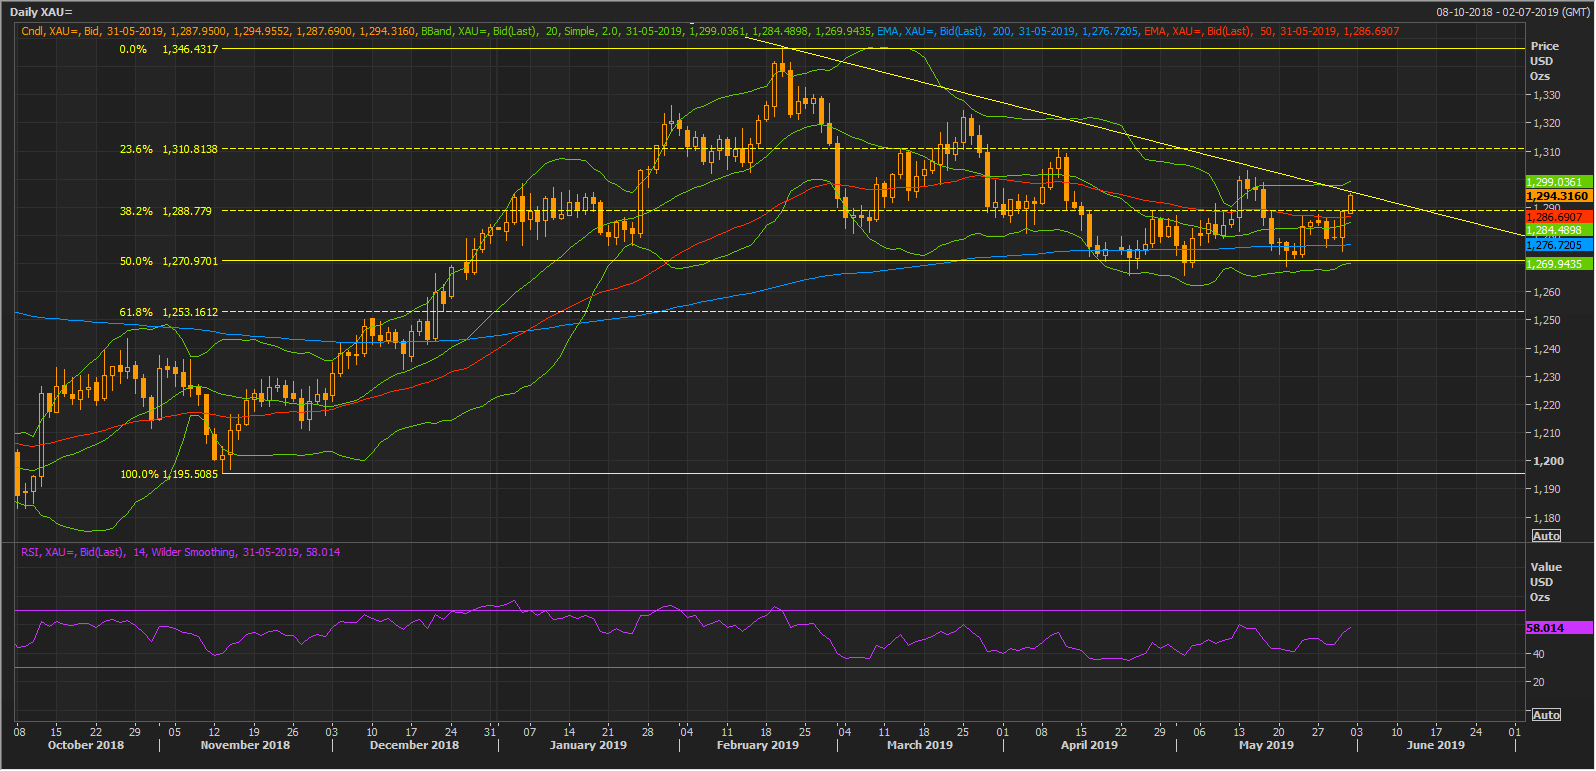 XAU Daily Chart (Source: Thomson Reuters)
The careful observation on a daily chart reveals that the gold prices are trading above the median of the Bollinger band, which consists of 20-days simple moving average. The prices are trading near the downward sloping trendline, which could offer resistance to the prices.
The Upper band of the Bollinger is also trading around the trendline (Yellow line), and the gold prices might leap to test it. Failure to break above the trendline or a breakout above it would decide the further trend of gold prices on a daily chart.
 XAU Hourly Chart (Source: Thomson Reuters)
However, on an hourly chart, the gold prices have shown a breakout of the previous level, which offered a resistance earlier, and an ability to sustain above the breakout level could provide support to the prices.
Disclaimer
This website is a service of Kalkine Media Pty. Ltd. A.C.N. 629 651 672. The website has been prepared for informational purposes only and is not intended to be used as a complete source of information on any particular company. Kalkine Media does not in any way endorse or recommend individuals, products or services that may be discussed on this site. Our publications are NOT a solicitation or recommendation to buy, sell or hold. We are neither licensed nor qualified to provide investment advice.
