


The United States economy appears to be cooling a bit with recent economic figures coupled with higher liquidity pooled by the Federal Reserve is exerting pressure on its currency.
Recently, the International Monetary Fund forecasted that the global economy could witness a contraction of 3 per cent in the wake of the COVID-19 outbreak, while the advanced economies like the United States could face an economic contraction of 5.9 per cent in 2020.
While the forecast from IMF depicts that the United States economic conditions could deteriorate, the latest economic figures are syncing in tune to the forecast.
Latest Economic Figures and Their Implications
- The United States Labor Market
The United States employers laid off about 701,000 jobs in March 2020, which further overshot the market anticipation of a decline of 100,000 payrolls for March 2020 as compared to the February 2020 anticipation of a 275,000 increase. As a result of the same, the three-month moving average of non-farm payroll slipped to stand at ~ 71,000 in March 2020 as compared to its previous rise of ~224,000 in February.
The service sector across the United States took a major hit, shedding ~ 459,000 jobs; as a result, the unemployment rate shot up to a two-year high of 4.4 per cent in March 2020.
- ISM Manufacturing Index Under Contractionary Territory
The Institute of Supply Management (ISM) reported the manufacturing index for March 2020 at 49.1, which remained below its value of 50.0 and its previous level of 50.1; however, the index remained above the market consensus of 44.5. The ISM below 50.0 typically denotes a contraction in manufacturing activities.
Not just ISM index, other pivotal economic figures such as consumer confidence also took a toll with the index falling to 120.0 in March 2020 against its previous revised level of 132.6 in February 2020.
While the economic figures are taking a hit, the United States Federal Reserve has opened many doors for households, businesses, for easy lending, which coupled with deteriorating economic conditions is keeping the dollar price under check.
To Know More, Do Read: Gold Shatters 7-Year High, Joy Ride Coming For ASX-listed Gold Stocks?
Dollar Index on Charts
- DXY on a Monthly Chart
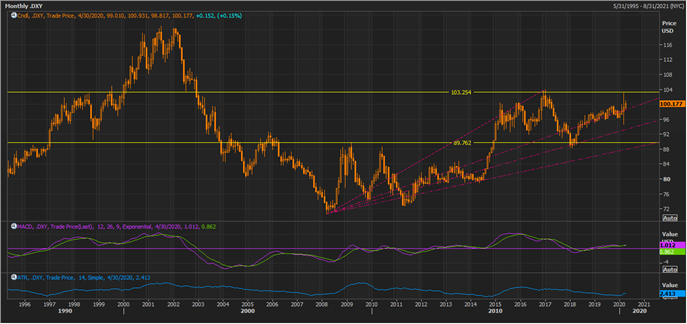
DXY on a Monthly Chart (Source: Thomson Reuters)
On the monthly time frame, the index had previously tested its long-term resistance level and fell; however, it is again trying to retest the long-term resistance level. The moving average convergence and divergence or MACD indicator is giving a positive signal, which coupled with low volatility or falling average true range (or ATR) and slight consolidation in the past and current month suggest that accumulation phase in underway.
On projecting the Fibonacci fan from the recent low to the high, it could also be seen that the index is currently taking the support of the 1/3 fraction of the projected level.
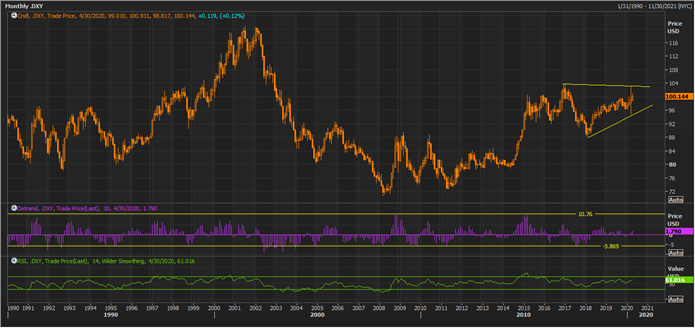
DXY on a Monthly Chart (Source: Thomson Reuters)
On further following the monthly chart, it could be seen that the 14-month Relative Strength Index is moving in tandem with the price and is currently hovering above its mean value of 50.0. The Detrend price oscillator is currently below the peak value of 10.76, and the previous behaviour of the Detrend price oscillator suggests that the index might take few months of consolidation before rising to its previous peaks.
While the index is currently testing its previous peak, the Detrend price oscillator is not following the price action, which provides the current resistance line some weightage.
Also, it should be noticed that the index recent price action is somewhat resembling a potential ascending triangle pattern, which is yet pending confirmation.
- DXY on a Weekly Chart
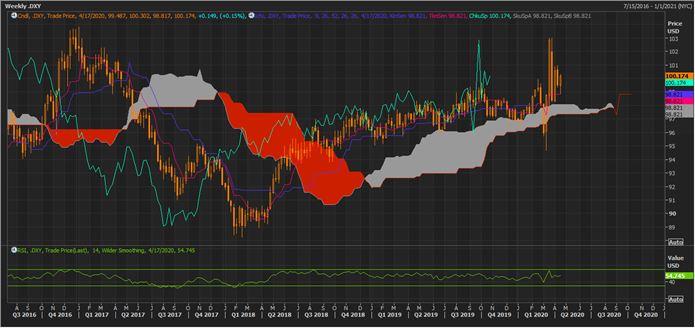
DXY on a Weekly Chart (Source: Thomson Reuters)
Post applying the Ichimoku clouding technique on the weekly chart, it could be noticed that the index is currently at the support cloud or Span A (which represents the mean value of the conversion line (pink line) and the base line (blue line).
The conversion line, which represents the mean value of 9-week high and low is showing a positive crossover with the base line (which is the mean value of 26-week high and low), suggesting that the current trend on the weekly timeframe is an uptrend.
The 14-week RSI is moving in tandem with the price action; however, the spread between Span A and Span B (mean value of 52-week high and low) is narrowing down, suggesting that bears might enter the market if the index does not break and sustain above the projected resistance zone.
- DXY on a Daily Chart
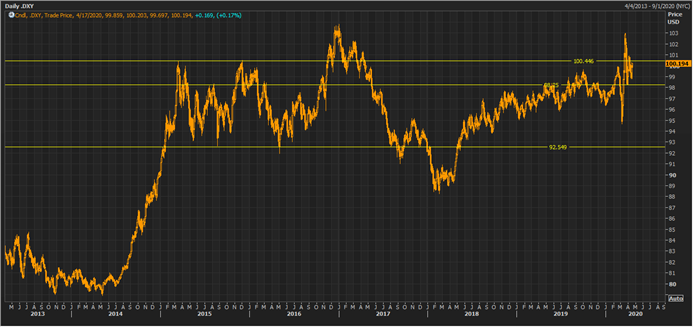
DXY on a Daily Chart (Source: Thomson Reuters)
On the daily chart, it could be seen that the index is currently moving between the long-term resistance and support zone. The index recently broke above the long-term resistance on a daily timeframe; however, unable to sustain at the level and retracted back to the support line, from where the index is again moving up to test the resistance level.
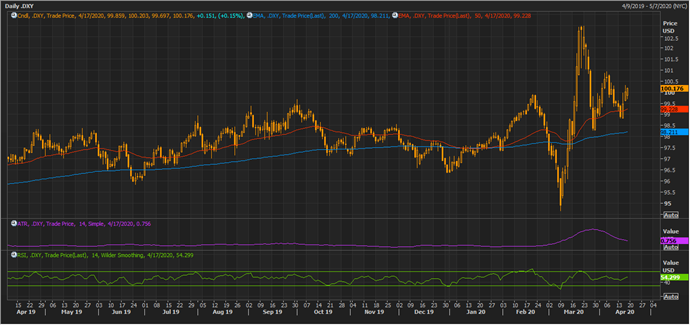
DXY on a Daily Chart (Source: Thomson Reuters)
The index is currently trading above the short-term 50-day exponential moving average as well as medium-term 200-day exponential moving average, while 50-day EMA is trading above 200-day EMA, suggesting that bulls are currently in strength.
While the 14-day RSI is moving in tandem with the price, the average true range of the index on a daily timeframe is moving down, suggesting a loss in volatility around the resistance line, and some consolidation might take place over the coming period.
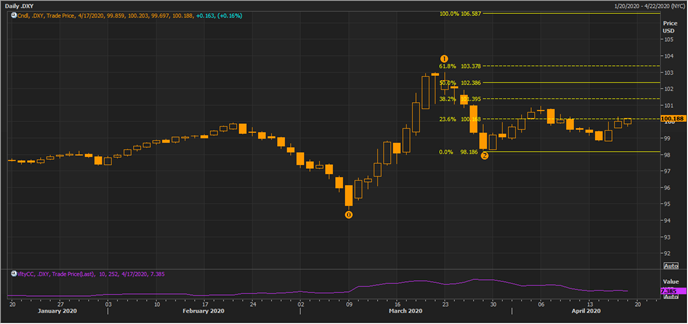
DXY on a Daily Chart (Source: Thomson Reuters)
On connecting the Fibonacci projections from the wave points 0,1, and 2, it could be seen that the index is currently facing resistance at the 23.6 per cent of the projected level, and as per the classical Fibonacci implications, every projected level from a wave serve as resistance and possible target level of the future movement, while the 50.0, and 100.0 per cent projected levels are generally considered as the most valuable resistance level.
