


The below mentioned companies reported a sound financial performance with growth across key metrics and delivery of decent dividends during the latest financial reporting period. Let us have a look at the performance of the companies in detail.
Dexus
Dexus (ASX:DXS) owns and develops high quality real estate assets and manages real estate funds on behalf of third-party investors.
Sale of North Shore Health Hub: The company recently updated that it has executed a contract to sell the North Shore Health Hub to Healthcare Wholesale Property Fund. Stage 1 of the hub is currently under development and is expected to create trading profits for the company in FY20 and FY21. Expected contribution from the sale will be approximately $18 million - $22 million in the form of pre-tax trading profits.
Key Financial Highlights for the year ended 30 June 2019:
- In FY19, the company reported growth of 5.5% adjusted funds from operations per security at 50.3 cents.
- Distribution per security witnessed growth of 5.0% at 50.2 cents.
- Net profit after tax was reported at $1.28 billion, down 25.9% on FY18 on account of net revaluation gains of investment properties which were lesser than in the prior corresponding period.
- The companyâs office portfolio reported an increase in the occupancy rate from 96.0% in FY18 to 98.0% in FY19. Growth was supported by leasing in the largest core market of the company.
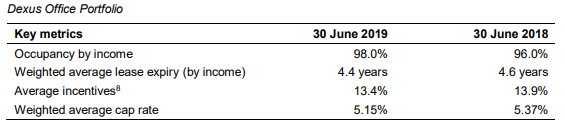
Dexusâ Office Portfolio (Source: Company Reports)
FY20 Guidance: For the year ending 30 June 2020, the company expects to deliver distribution per security growth of approximately 5%. The company has a group development and concept pipeline of approximately $9.3 billion that will offer long-term value to the business.
The stock of the company generated negative returns of 7.52% and 8.93% over a period of 1 month and 3 months, respectively. The stock closed at a market price of $12.150 on 02 October 2019.
Goodman Group
Goodman Group (ASX:GMG) is a global integrated property group which manages property and business space in key markets around the world.
FY19 Financial Results:
- During the year ended 30 June 2019, the company reported operating profit amounting to $942.3 million, representing an increase of 11.4% on prior corresponding period.
- Statutory profit for the period was reported at $1,627.9 million.
- During the year, the company reported operating earnings per share amounting to 51.6 cents, rising 10.5% on FY18.
- Distribution amounted to 30.0 cents per stapled security, increasing 7% on prior corresponding period. Net tangible assets per security stood at $5.34, rising 15% since 30 June 2018.
- Distribution for the six months ended 30 June 2019 amounted to 15 cents per security.

FY19 Key Metrics (Source: Company Presentation)
Total assets under management at the end of the period stood at $46.2 billion, representing an increase of 21% on FY18. In addition, the period was marked by significant valuation uplift of $3.8 billion across the group and partnerships. The company reported management earnings growth of 48% and average partnership total returns of 16%.
FY20 Guidance: In FY20, the company expects to report operating profit amounting to $1,040 million, up 10.4% on FY19. Operating EPS for the period is expected to be 56.3 cents, representing an increase of 9% in comparison to FY19. Distribution for the year is anticipated to be 30.0 cents per security.
The stock of the company generated negative returns of 2.34% and 6.83% over a period of 1 month and 3 months, respectively and has a market capitalisation of $26.44 billion. The stock closed at a market price of $14.340 on 2 October 2019.
Scentre Group
Scentre Group (ASX:SCG) owns and operates a retail property portfolio in Australia and New Zealand. On October 1, 2019, the company bought back a total of 16,083,597 shares for a total consideration of $63.31 million. The company will buy back shares for a total consideration amounting to $8 billion.
Key financial Performance for the half-year ended 30 June 2019:
- During the first half-year ended 30 June 2019, the company generated revenue amounting to $1,302.9 million, rising 1.6% in comparison to prior corresponding period (pcp) revenue of $1,282.2 million.
- Profit after tax for the period went down by 49.4% at $740 million, as compared to a profit of $1,462.6 million in pcp.
- Funds from operations attributable to members were reported at $676.2 million, representing an increase of 2.9% on pcp value of $657.2 million.
- Dividend paid to the shareholder amounted to 11.30 cents per stapled security, paid on 30 August 2019.
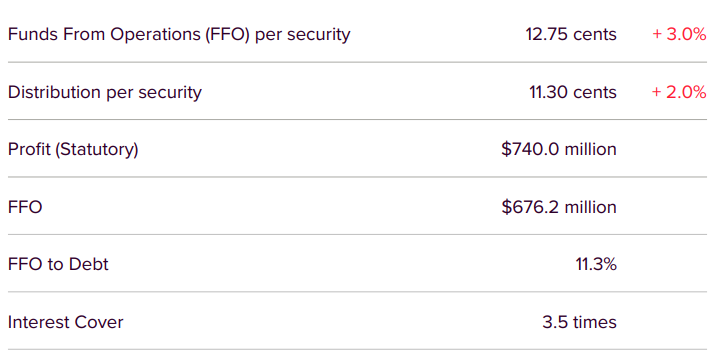
1H19 Results (Source: Company Presentation)
Segment Performance: During the first-half of 2019, revenue for the property investment segment was reported at $1,194.9 million as compared to prior corresponding period revenue of $1,157.7 million. Revenue for the Property management and construction segment stood at $185.0 million, as compared to prior corresponding period revenue of $206.2 million.
Geographical Update: Australia contributed a large chunk of the property revenue in the first half-year, amounting to $1,144.4 million. Revenue from New Zealand stood at $50.5 million in the first half-year. Property development and construction revenue from Australia amounted to $76.2 million and that from New Zealand stood at $108.8 million.
Outlook: Funds from operations per security in FY19 are expected to report an approximate growth of 0.7%. The company did not take into account the positive impact of the security buy-back program while forecasting growth for FY19. Distribution for FY19 is anticipated to be 22.60 cents per security, representing an increase of 2% on prior year.
The stock of the company closed at a market price of $3.940 on 02 October 2019.
Mirvac Group
Mirvac Group (ASX:MGR) is involved in real estate investment. Third party capital management and property asset management are also the companyâs activities.
Key Financial Results for the year ended 30 June 2019:
- Operating profit for the year amounted to $631 million, up 4% in comparison to prior corresponding period profit of $608 million.
- Return on Invested Capital for the group was reported at 10.1%.
- The period was marked by strong uplift of $516 million in net property revaluation across the investment portfolio.
- Net tangible assets per stapled security for the period were reported at $2.50, as compared to $2.31 in prior corresponding year.
- Operating cashflow for the period stood at $518 million, as compared to $663 million in pcp.
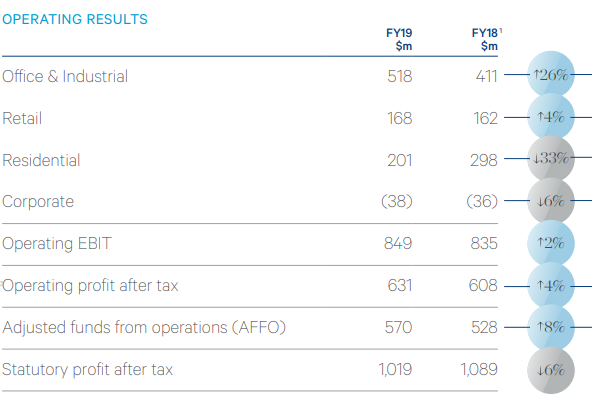
Financial Results (Source: Company Presentation)
The stock of the company generated negative returns of 4.08% and 3.16% over a period of 1 month and 3 months, respectively. The stock closed at a market price of $3.100 on 02 October 2019.
GPT Group
GPT Group (ASX:GPT) owns and manages a diversified portfolio of retail offices, shopping centres and business parks across Australia.
Interim Results: During the six months ended 30 June 2019, the company reported net profit after tax amounting to $352.6 million, down 51.6% on prior corresponding period. Funds from operations amounted to $295.9 million, representing FFO per security growth of 2.0% on prior corresponding period. Net tangible assets for the period amounted to $5.66 per security, rising 1.4% on 31 December 2018.
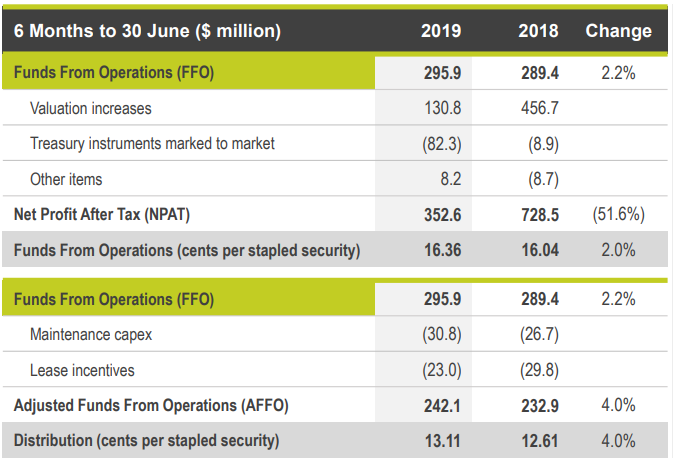
Financial Summary (Source: Company Presentation)
During the first half, the company completed a placement of $800 million. In addition, the period also saw the launch of a Security Purchase Plan for logistics growth opportunities and funding the acquisition of a property in Sydney. Distribution for the period amounted to 13.11 cents per security, rising 4.0% on prior corresponding period.
FY19 Guidance: In FY19, funds from operations per security are expected to grow at a rate of 2.5% in comparison to FY18. Distribution per security for the year is expected to reported growth of 4.0%.
The stock of the company generated negative returns of 3.60% and 0.16% over a period of 1 month and 3 months, respectively. The stock closed at a market price of $6.170 on 02 October 2019.
Disclaimer
This website is a service of Kalkine Media Pty. Ltd. A.C.N. 629 651 672. The website has been prepared for informational purposes only and is not intended to be used as a complete source of information on any particular company. Kalkine Media does not in any way endorse or recommend individuals, products or services that may be discussed on this site. Our publications are NOT a solicitation or recommendation to buy, sell or hold. We are neither licensed nor qualified to provide investment advice.
