


Technical Analysis is defined as the art and science of predicting future movements of the price of any security based on the detailed analysis of past price movements. It involves acquiring data on financial instruments (instrument) and constructing charts while also applying numerous patterns and indicators to predict the future movements; the data consists of prices, volume, open interest etc.
The period on which technical analysis is applied to the data ranges from one-minute, five-minutes, thirty-minutes or hourly, daily, weekly or monthly to many yearly. Analysing an investment opportunity mainly involves two broad methods viz fundamental analysis and technical analysis.
In this article, we shall be briefly discussing some technical analysis methods, mainly focusing on a major oscillator â RSI. In order to proceed, it is beneficial to know what an oscillator is. An oscillator is one of the technical indicators, which aids the chartist/trader to predict the overbought and oversold conditions of a financial instrument. Typically, an Oscillator is a line graph which is constructed in the two extremes and as the name suggests it oscillates between the two extremes.
Relative Strength Index (RSI)
New Concepts in Technical Trading Strategies â a book by J. Welles Wilder Jr in the year 1978, marked the emergence of Relative Strength Index (RSI) to predict future movements.
Technical analysis includes several oscillators, Relative Strength Index (RSI) is one of the popular momentum oscillators used by chartists/traders. RSI is used to detect overbought and oversold conditions for any financial instruments, and RSI is constructed as an oscillator which oscillates between the range of 0 to 100.
Momentum
Momentum is the rate of change, it is intensity with which a stock or instrument rises or falls, and measuring its intensity is a useful device for guessing the impending change. For instance â Assume that you were sharing a ride with your friend and the vehicle starts to slow down, while you would predict that you may stop as the speed of the vehicle is slowing down. Concurrently, intensity (speed) also provides insights on the prediction of the future price action.
Oscillator
An Oscillator is an indicator that ranges between two limits as prescribed, mainly as the upper limit and lower limit. Further, when an oscillator attains a new high, it represents that an uptrend is picking up momentum and maybe it would continue to do so. Meanwhile, when an oscillator crashes into a new low; this represents that the trend has stopped, and it is likely that reversal would be on the cards.
Formula & Calculation of RSI
While the word ârelativeâ suggest a comparison, it should be noted that RSI only uses one stock for the comparison. RSI compares the scale of recent losses and recent gains and transforms that into ranges from 0 to 100. It uses only one parameter, which is the duration of the time periods â 14 days, as suggested by Mr Wilder in his book. It involves a two-part calculation, and a smoothed version can be calculated as well. The formula for RSI is as stated below:
RSI = 100-(100/1+RS)
RS stands for relative strength, which is calculated by dividing average gain by average loss in the preceding 14 days period (absolute value of the average loss is considered). So, RS is calculated as:
RS = (Average Gain/Average Loss)
Average Gain = Total Gains/14
Average Loss = Total Losses/14
Letâs assume that total gains in the 14 days period had been 3.34. Similarly, total losses in the same period had been 1.39. Now, we shall calculate the average gain and average loss.
Average Gain = 3.34/14 = 0.24
Average Loss = 1.39/14 = 0.10
RS = 0.24/0.10 = 2.39
RSI = 100-(100/1+2.39) = 70.53
For smoothing the results further, the below formula can be used. It should be noted that all subsequent calculations use the previous period values of average gain and average loss to calculate RSI for smoothing purposes.
Smoothed RS =
{(prior average gain*13 + current gain)/14}/ {(prior average loss*13 + current loss)/14}
RSI Signals
In an RSI chart, there are two pair of horizontal reference lines, namely 70% âoverboughtâ and 30% âoversoldâ lines. Further, the overbought situation refers to the case when the RSI oscillator has moved into the territory of buying pressure compared to the recent past; this indicates that an upward trend is about to end. Similarly, the oversold situation refers to the case when the RSI oscillator has moved into the territory of selling pressure compared to the recent past; this indicates that a downward trend is about to end.
Neo-Technicians have been promoting the idea that the overbought conditions depicted by RSI could have a downward trend much lower than the 70% level suggested by Mr Wilder. Simultaneously, oversold conditions reflected by RSI could have upward trend much higher than the 30%.
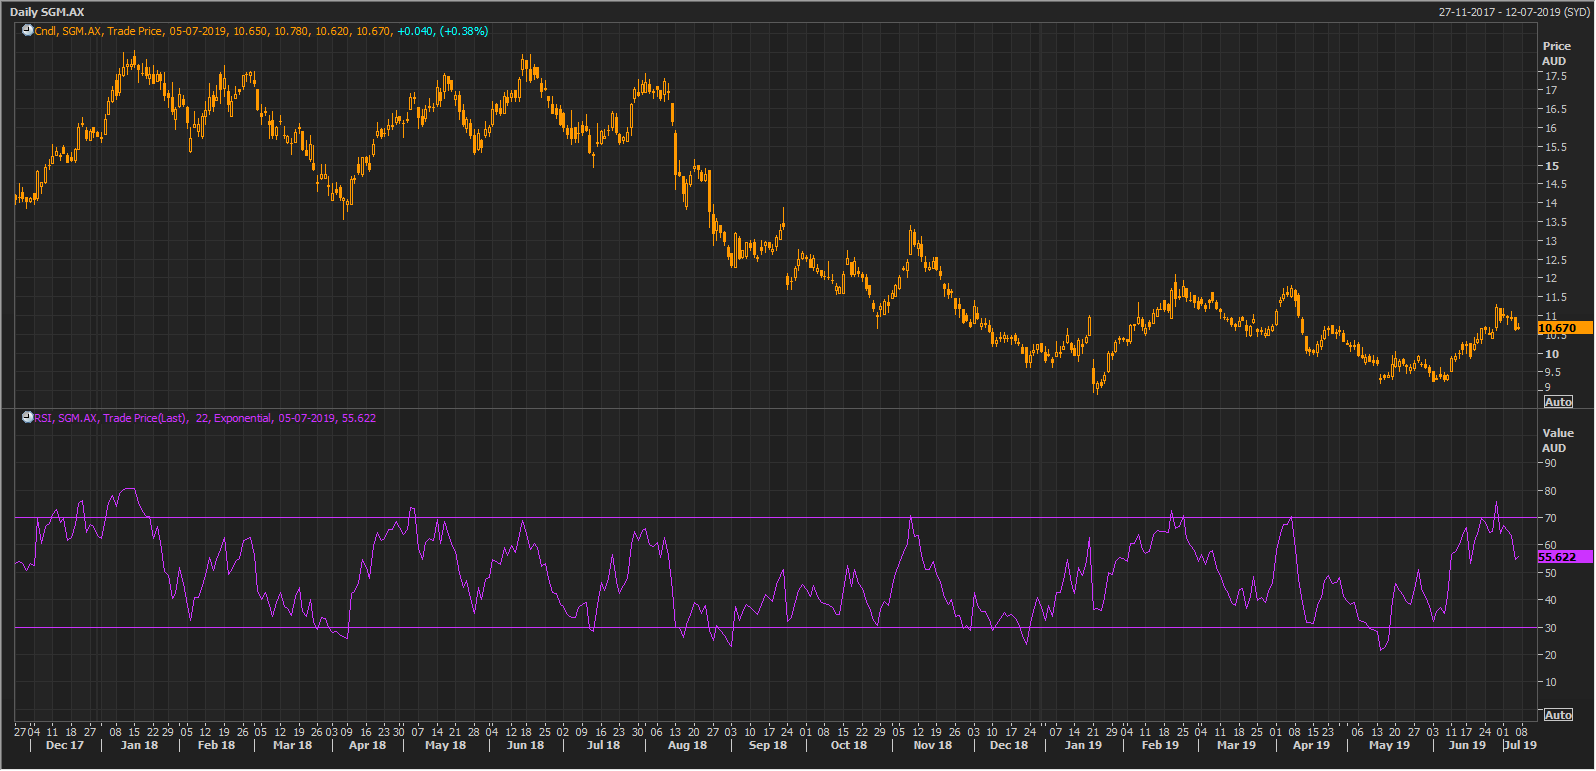
SGM Daily Chart (Source: Thomson Reuters)
In the above daily chart of Sims Metal Management Limited (ASX:SGM), the RSI is plotted at the bottom of the chart. We can see that there are two horizontal lines marking the overbought (70%) and oversold (30%) levels. We can observe that the RSI, true to its nature, oscillates between the two zones. The readers can observe that as the RSI reaches the overbought zone the stock price loses momentum and starts to drop, similarly as the RSI reaches the oversold zone the stock price bounces up.
Divergences
Divergences provide insight on alternative ways of interpreting RSI through analysing divergence between price peaks and indicator peaks.
If the price of the stock attains a higher level while the momentum indicator is not positively correlated with the price movement of the stock; this indicates that new highs are driven by less intensity, and less intensity may not support the higher price level indicating an expectation of a price reversal. If the price of the stock slumps to a lower level while the momentum contradicts the price movement; this depicts that downward movement is lacking the strength and price reversal could be expected.
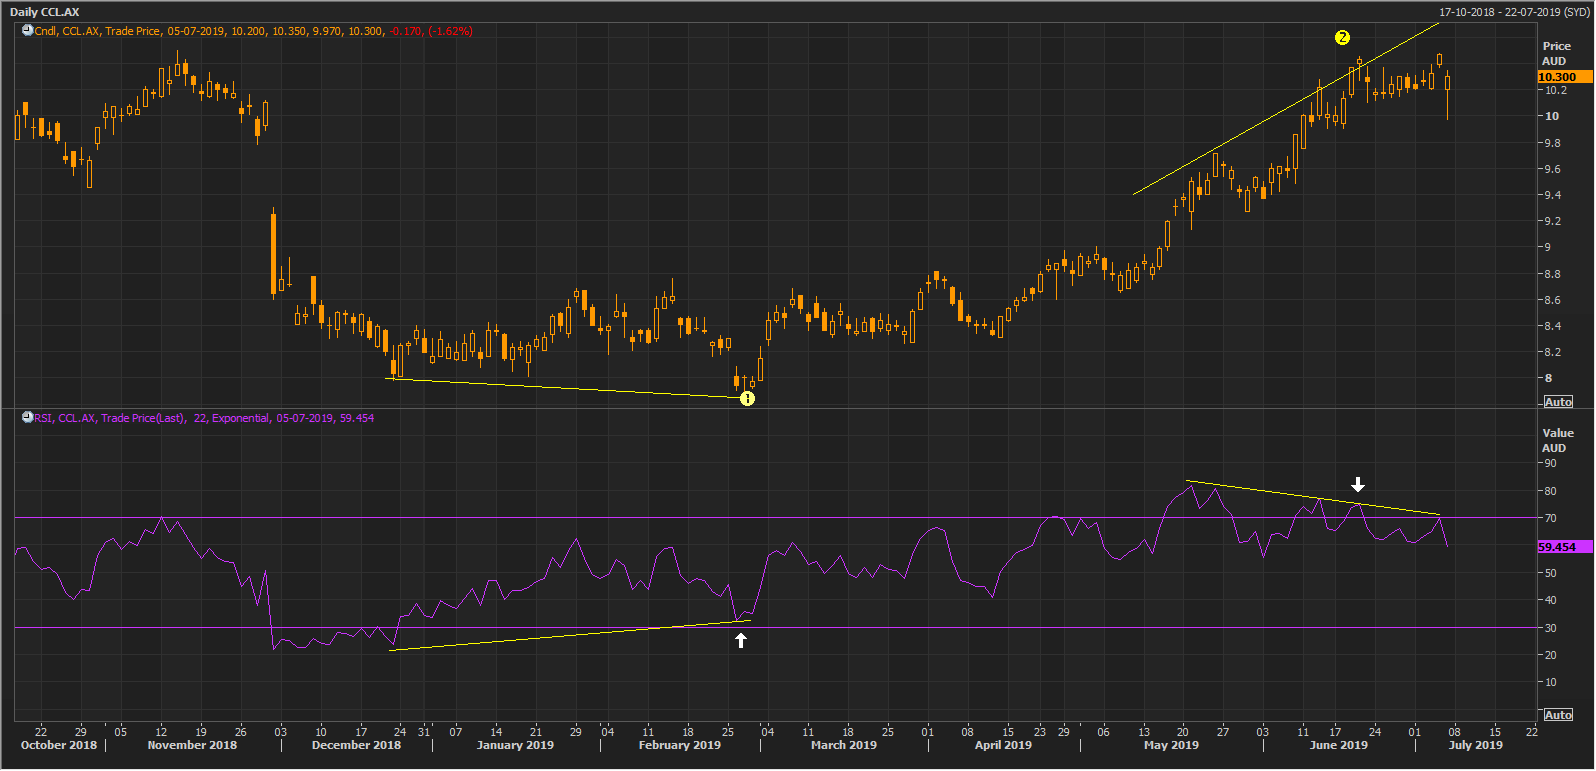
CCL Daily Chart (Source: Thomson Reuters)
In the above daily chart of Coca-Cola Amatil Limited (ASX: CCL) at point â1â on the above chart the price reaches a new low, but the RSI oscillator does not reach a new low (marked by Up arrow), which indicates that downward price movement is getting off the pace, and an upward move is expected â Positive Divergence. Meanwhile, at point â2â the price reaches a new peak, but the RSI does not make a new high (marked by down arrow); this marks a bearish divergence and a downward move is expected.
RSI Swing Failures
RSI divergence happens if the price movement and RSI diverge from one another, which depicts that momentum is fading in the trend. In this part, we shall analyse the implication of RSI while it is making a move from either overbought or oversold zones.
Swing Top/Bearish
It happens when the price reaches a higher high, but RSI does not mark a new high and falls below the recent swing low of the indicator, which indicates a sell signal. In layman terms, initially RSI rises to the overbought territory and comes back below the 70% level, then it forms another high without attaining the 70% level, and then it breaks the most recent low.
Swing Low/Bullish
It happens when the price reaches a lower low, but RSI does not mark a new low and rises above the recent swing low of the indicator, which indicates a buy signal. In layman terms, initially RSI falls to the oversold territory and comes back above the 30% level, then it forms another dip without dropping below the 30% level, and then it breaks the most recent highs.
Bear Market
RSI tends to move up during the period when bears rally, and at times the resistance is attained at the level of 60. Concurrently, if RSI breaches the 60 level and attains resistance at 70; this depicts a sign that markets/stocks might be shifting from bearish to the bullish environment.
When RSI crashes and finds support in the range of 20 to 30. Concurrently, if RSI finds support around 40; this depicts that markets turning from bearish to bullish.
Bull Market
When RSI moves down in the periods of decline, and usually find support around 40. In such decline, if RSI breaches 40 and finds support around 30; this marks the emergence of shifting from bullish markets to the bearish markets.
When RSI soars up and finds resistance around 70, in such moves, if RSI finds resistance around 60: it marks the emergence of a shift in the market from bullish to bearish.
Limitations of RSI
RSI considers a small period; hence, it can move without considering the long term picture. It is reliable when the signals follow a long term trend. It is also said that RSI is reliable when the trades are in the bullish and bearish periods as against flat or sideways market. Further, some key points also include:
- RSI in overbought levels does not always signify an overbought Market.
- RSI in oversold levels does not always signify an oversold Market.
- A bullish divergence may not always lead to a rally.
- A bearish divergence may not always lead to a decline.
- RSI can stay in oversold/overbought zones for an extended duration.
Moving Average Convergence Divergence (MACD)
During 1970s Mr Gerald Appel created MACD. MACD is also a trend indicator developed by Gerald Appel. It represents the association between two moving averages of the stock price. Before we explain MACD, we shall discuss the MA and EMA.
Moving Average (MA)
Moving Average is a trend following indicator in which the data is smoothed, making it easier to spot trends. It aids the trader in the volatile markets while also applied as a base for many technical indicators and overlays. Two of the most common moving averages are Simple Moving Average & Exponential Moving Average.
Exponential Moving Average (EMA)
It is also called exponentially weighted moving average, and while deriving the EMA, more weights are assigned to recent prices compared to older prices. Further, weights are assigned on the basis of most recent prices of the specific range or period.
Moving Average Convergence Divergence is a technical analysis indicator; it is an extension of two moving averages, which measure the distance between two moving average lines. It comprises two lines being the fast line and the signal line.
Calculation
Initially, calculate the 12-period exponential moving average of the close price, and the next step involves calculating a 26-period exponential moving average of the close price. Now, 26-period EMA is deducted from the 12-period EMA, which provides the fast line. Lastly, calculate the 9-period Exponential Moving Average of the fast line, which gives the signal MACD line.
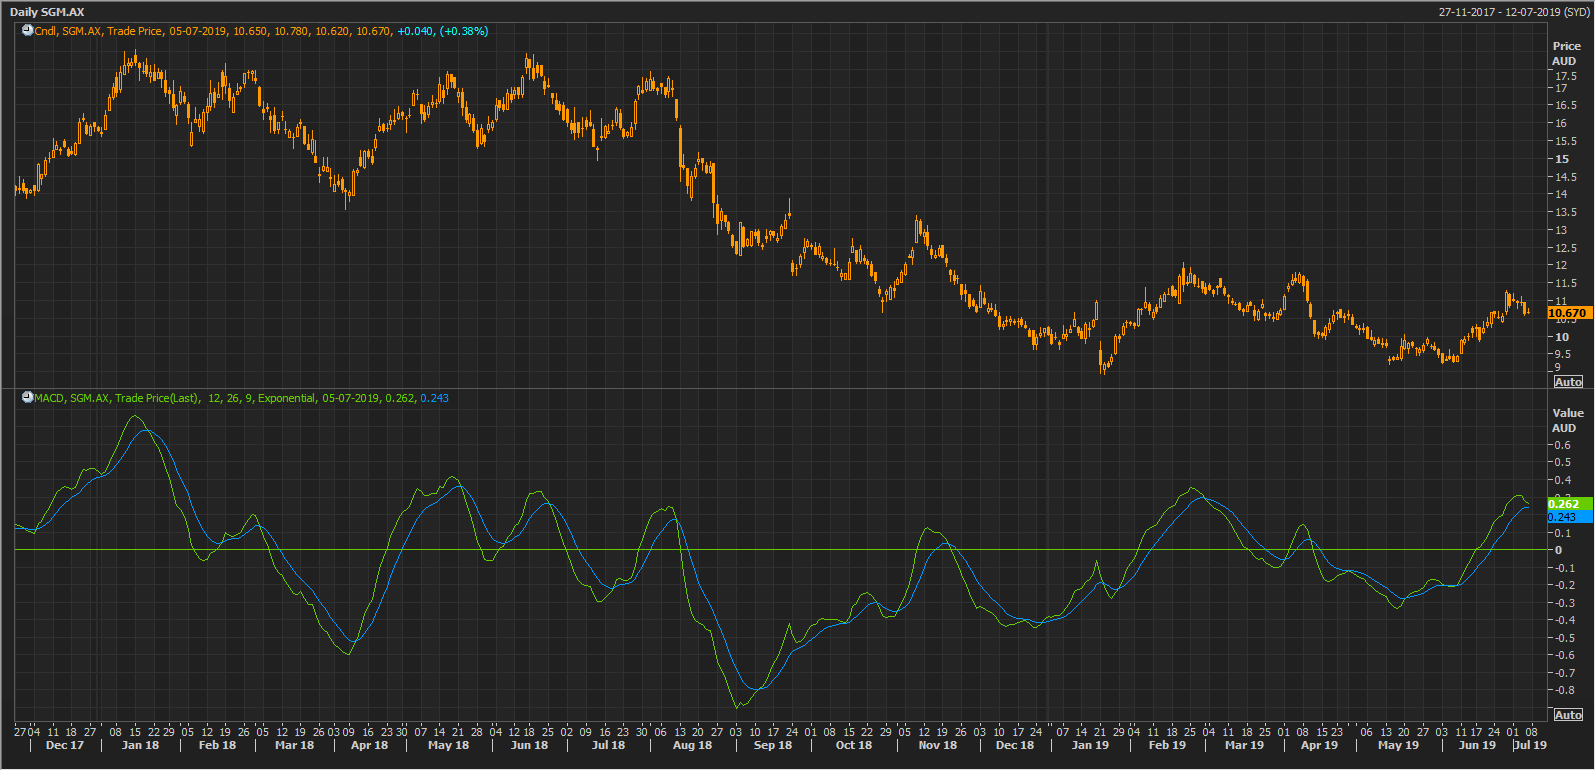
SGM Daily Chart (Source: Thomson Reuters)
MACD depicts the relationship between 2 moving averages of a stock price. Further, MACD can be calculated by deducting the 26-period EMA from the 12-period EMA, and this would give you the MACD line. Moreover, a signal line is formed by taking the nine-day EMA of MACD, which is plotted along with the MACD line; this would function for triggering signals to buy or sell.
RSI & MACD
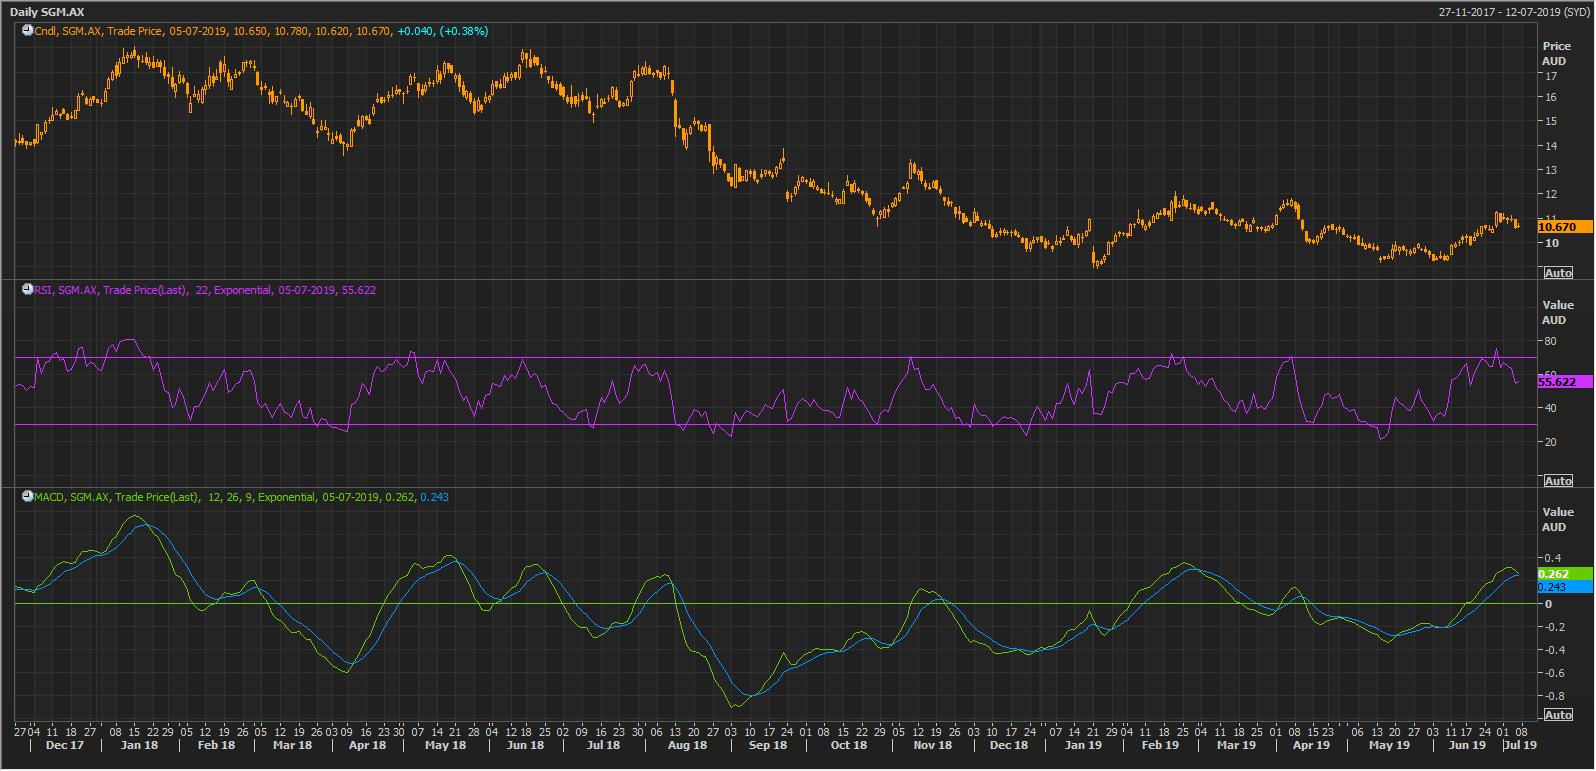
SGM Daily Chart (Source: Thomson Reuters)
MACD & RSI are two indicators in Technical Analysis, which measure the price momentum of the security. Both these indicators are different from each other. A MACD is applied to scale the relationship in two types of EMAs to make a judgement call. However, RSI is a tool to predict the future movements of price on the basis of the stockâs recent highs and lows. Oftentimes, both of these indicators provide a complete picture of the stock from a technical perspective.
Disclaimer
This website is a service of Kalkine Media Pty. Ltd. A.C.N. 629 651 672. The website has been prepared for informational purposes only and is not intended to be used as a complete source of information on any particular company. Kalkine Media does not in any way endorse or recommend individuals, products or services that may be discussed on this site. Our publications are NOT a solicitation or recommendation to buy, sell or hold. We are neither licensed nor qualified to provide investment advice.
