


_07_03_2026_03_50_21_133108.jpg)

Highlights
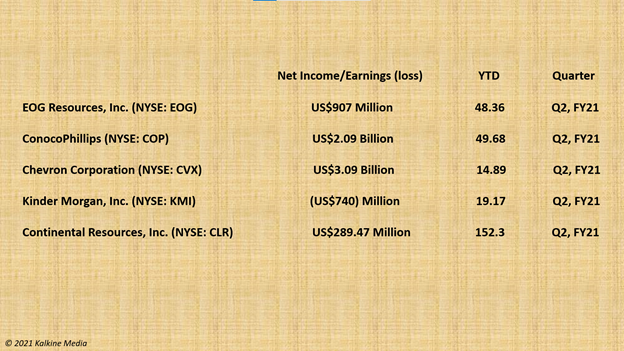
- The stock value of EOG Resources, Inc. (NYSE:EOG) rose 48.36% YTD.
- ConocoPhillips (NYSE:COP) earned US$4.25 Bn from operating activities in Q2, FY21.
- The stock value of Continental Resources, Inc. (NYSE:CLR) jumped 152.3% YTD.
Oil prices rose in recent days after supplies were hit due to Hurricane Ida. Oil production in the Gulf of Mexico region was closed after the storm struck late last month.
According to the US Bureau of Safety and Environmental Enforcement (BSSE), around 92.51 percent of the total output from the Gulf of Mexico remained shut as of September 4. The effects of these disruptions continue to linger. In addition, higher production cost may have pushed up the prices. OPEC also plans to boost daily production by around 400,000 barrels.
Against this backdrop, oil and gas stocks have been in investors' focus. Here we look at five oil and gas stocks with a price-to-earnings ratio of more than 20.
Also Read: AMC to accept Ethereum, Litecoin besides Bitcoin for booking tickets
EOG Resources, Inc. (NYSE:EOG)
EOG is an energy company based in Houston, Texas, with an interest in hydrocarbon exploration.
The stock traded at US$73.71 at 11:44 am ET on Sep 17, down 0.35 percent from its closing price of September 16. The stock gained 48.36 percent YTD. EOG has a market cap of US$43.06 billion, a P/E ratio of 22.91, and a forward P/E one year of 10.04. Its EPS is US$3.22.
Also Read: Five carbon capture startups catching the eyes of investors
The 52-week highest and lowest stock prices were US$87.99 and US$31.22, respectively. Its trading volume was 4,327,059 on September 16.
On a GAAP basis, the company's total revenue rose from US$1.10 billion in Q2, FY20 to US$4.13 billion in Q2 FY21. Its GAAP net income was US$907 million against a loss of US$910 million in Q2 FY20.
Also Read: US stocks retreat after mixed economic data
ConocoPhillips (NYSE:COP)
ConocoPhillips is also a hydrocarbon exploration company based in Houston, Texas.
The stock was priced at US$58.96 at 11:51 am ET on Sep 17, down 0.46 percent from its previous closing price. The COP stock rose 49.68 percent YTD.
Also Read: Check out these 5 Industrial stocks that gave over 18% return YTD
ConocoPhillips’ market cap is US$78.73 billion, the P/E Ratio is 50.69, the forward P/E one year is 12.44, and the EPS is US$1.16.
The 52-week highest and lowest stock prices were US$63.57 and US$27.53, respectively. Its share volume on Sep 16 was 8,773,081.
ConocoPhillips’ net earnings rose from US$0.26 billion or US$0.24 per share in Q2 FY20 to US$2.09 billion or US$1.55 per share in Q2 FY21. Its cash from operations was US$4.25 billion.
Also Read: Laos starts crypto mining, but Lagarde’s quirky quip has a point
Chevron Corporation (NYSE:CVX)
Chevron is a San Ramon, California-based energy company engaged in the exploration and refining of oil and natural gas.
The stock traded at US$96.50 at 12:03 pm ET on Sep 17, down 0.84 percent from its previous close. The stock surged 14.89 percent YTD.
Also Read: IronNet (IRNT), Sphere 3D (ANY) stocks draw huge attention Thursday
Chevron has a market cap of US$186.93 billion, a P/E Ratio of 51.69, a forward P/E one year of 14.46, and an EPS of US$1.87. The 52-week highest and lowest stock prices were US$113.11 and US$65.16, respectively. Its trading volume was 10,617,020 on Sep 16.
Chevron’s total revenue and other income totaled US$37.59 billion in Q2 FY21 compared to US$13.49 billion in Q2 FY20. Its net income was US$3.09 billion against a loss of US$8.27 billion in Q2 FY20.
Also Read: SBUX, BYND & APRN: Three trending food, restaurant stocks Thursday
Kinder Morgan, Inc. (NYSE:KMI)
Kinder is an energy infrastructure company and owns oil and gas pipelines. It is based in Houston, Texas.
The stock was priced at US$16.126 at 12:10 pm ET on Sep 17, down 0.21 percent from its previous closing price. The KMI stock soared 19.17 percent YTD.
Also Read: Eleven upcoming IPOs to keep an eye on in September
Its market cap is US$36.52 billion, the P/E ratio is 21.51, the forward P/E one year is 12.43, and its EPS is US$0.75. Kinder’s 52-week highest and lowest stock prices were US$19.29 and US$11.45, respectively. The trading volume on Sep 16 was 12,935,070.
Kinder’s revenue rose from US$2.56 billion in Q2 FY20 to US$3.15 billion in Q2 FY21. It reported a net loss of US$740 million against a loss of US$624 million in Q2 FY20.
Also Read: Greenidge (GREE), Indaptus (INDP) among most searched stocks Wednesday

Source: Pixabay
Continental Resources, Inc. (NYSE:CLR)
It is an Oklahoma-based company engaged in the exploration and production of natural gas and petroleum.
The stock traded at US$42.055 at 12:16 pm ET on Sep 17, down 2.81 percent from its closing price of September 16. The stock jumped 152.3 percent YTD.
Also Read: Top betting stocks to watch amid NFL craze, Macau casino review
Continental Resources has a market cap of US$15.42 billion, a P/E ratio of 40.76, a forward P/E one year of 10.98, and its EPS is US$1.03.
The 52-week highest and lowest stock prices were US$43.67 and US$11.09, respectively. Its trading volume was 2,657,563 on Sep 16.
Continental’s total revenue jumped from US$175 million in Q2 FY20 to US$1.23 billion in Q2 FY21. Its net income was US$289.47 million against a loss of US$242.13 million in Q2, FY20.
Also Read: Dutch Bros & On Holding IPOs: Check price, lot size, other details
Bottomline
On Friday, crude oil prices declined by 1.12 percent to US$71.75 at 11:13 am ET. Analysts exuded confidence in the industry's growth, with rapid progress in the economy. The energy sector of the S&P 500 index jumped 30.02 percent YTD and 2.70 percent MTD. However, investors must carefully evaluate the companies before investing in stocks.
