


Highlights
- Energy Select Sector SPDR Fund (XLE) generated a 19.85% return YTD. The ETF has an expense ratio of 0.12%.
- Vanguard Energy ETF (VDE) generated an 18.21% return YTD. It has an expense ratio of 0.10%.
- Fidelity MSCI Energy Index (FENY) ETF generated an 18.19% return year-to-date. Its expense ratio is 0.08%.
The energy sector has many big players. But major geopolitical tensions adversely affect the industry. The ongoing Ukraine crisis triggered a massive oil price rally on supply concerns.
Analysts expect the benchmark Brent crude to hit US$100 per barrel by the year-end.
The Bloomberg Brent Crude Subindex, formerly Dow Jones-UBS Brent Crude Subindex, rose 62.23% in one year and 19.05% YTD, outperforming the S&P 500’s 13.81% one-year return.
Also Read: From TWTR to U: Web3 stocks in focus after LeBron ad creates buzz
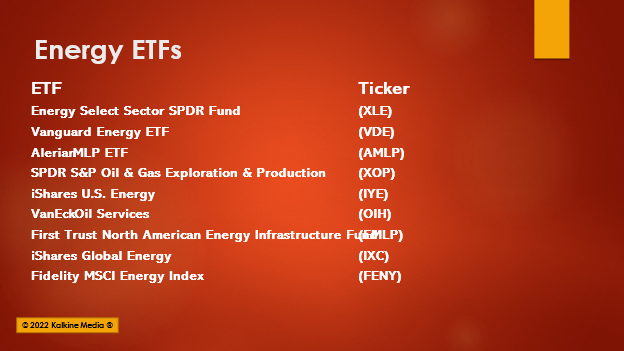
Energy ETFs invests in oil, gas, and alternate energy companies.
The following are nine energy ETFs based on top assets under management.
Also Read: From UPS, RTX to HON: Top industrial stocks to explore in 2022
Energy Select Sector SPDR Fund (XLE)
Expense ratio – 0.12%
Asset under management (AUM) - US$35.05 billion
50 days daily average volume - 21,952,217
Total holdings - 23
The XLE ETF offers exposure to US energy companies based on weighted market cap. These companies are engaged in oil and gas, consumable fuels, energy equipment and service industries. There is also a capping of 25% on a single stock holding at each quarterly rebalance.
This open-ended fund was launched in 1998 by State Street Global Advisor. It tracks S&P Energy Select Sector Index.
Its top three holdings include Exxon Mobil (XOM), and Chevron (CVS), which account for more than 20%, followed by EOG Resources (EOG) with around 5%.
XLE generated a 19.85% return YTD and closed at US$68.58 on February 16, 2022.
Also Read: SEC fines BlockFi a record US$100-mn for violating registration rules
Vanguard Energy ETF (VDE)
Expense ratio – 0.10%
Asset under management (AUM) - US$7.35 billion
50 days daily average volume - 718,452
Total holdings - 104
The VDE ETF invests in energy stocks in the US. The fund includes energy companies across sub-industries classified by the GICS and selects companies considered investible by MSCI.
VDE tracks MSCI US Investible Market Energy 25/50 Index. VDE is an open-ended fund launched in 2004 by Vanguard. VDE generated an 18.21% return YTD and closed at US$94.69 on February 16, 2022.
Also Read: Florida woman pays in Ethereum (ETH) to buy home in Propy auction
Alerian MLP ETF (AMLP)
Expense ratio – 0.90%
Asset under management (AUM) - US$6.2 billion
50 days daily average volume - 3,348,662
Total holdings - 18
The AMLP invests in the energy infrastructure MLPs (master limited partnership). MLP is a publicly-traded entity but taxed as a partnership. The companies listed on its market-cap-weighted index earn primarily from midstream activities.
Launched in 2010 by SS&C, this ETF is structured as a C-Corporation, which means the fund allows total allocation to MLPs. It tracks Alerian MLP Infrastructure.
AMLP generated a 10.00% return YTD and closed at US$37.05 on February 16, 2022.
Also Read: Moneygram (MGI) stock soars on US$1.8 bn purchase offer by Madison
Also Read: Explore these top gaming stocks – from RBLX to AMC
SPDR S&P Oil & Gas Exploration & Production - (XOP)
Expense ratio – 0.35%
Asset under management (AUM) - US$4.6 billion
50 days daily average volume - 6,544,361
Total holdings - 61
XOP offers exposure to the oil and gas exploration and production segment companies of the S&P Total Market Index. It provides an equal-weighted approach for selecting the stocks. The index is reviewed and rebalanced quarterly.
The ETF was launched in 2006 by State Street Global Advisors. The open-ended fund tracks S&P oil and gas exploration & production select industry index.
XOP generated a 9.07% return YTD and closed at US$109.53 on February 16, 2022.
Also Read: Intel Corporation (INTC) acquires Tower (TSEM) for US$5.4 billion
iShares U.S. Energy - (IYE)
Expense ratio – 0.41%
Asset under management (AUM) - US$2.96 billion
50 days daily average volume - 1,378,217
Total holdings - 39
IYE invests in energy companies in the US. Its tracks Russell 1000 Energy RIC 22.5/45 Capped Index. Earlier, it had tracked the Dow Jones US Oil & Gas Index.
This open-ended ETF was launched in 2000 by Blackrock.
IYE generated a 17.39% return YTD and closed at US$36.39 on February 16, 2022.
Also Read: S&P 500’s top oil and gas stocks to watch as prices shoot up
VanEck Oil Services - (OIH)
Expense ratio – 0.35%
Asset under management (AUM) - US$2.8 billion
50 days daily average volume - 544,603
Total holdings - 26
The OIH ETF invests in the 25 largest and most liquid oil services companies listed in the US. Although it has some exposure in overseas companies, the fund primarily focuses on US companies. The index is rebalanced semi-annually. Its tracks the MVIS US Listed Oil Service 25 Index. The open-ended fund was launched in 2001 by VanEck.
The OIH generated a 25.98% return YTD and closed at US$248.54 on February 16, 2022.
Also Read: From RIVN to TSLA: top 7 to watch as EV stocks brave global selloff
First Trust North American Energy Infrastructure Fund - (EMLP)
Expense ratio – 0.96%
Asset under management (AUM) - US$2.2 billion
50 days daily average volume - 533,380
Total holdings - 62
EMLP is an actively managed fund that invests in energy infrastructure MLPs and LLCs. But unlike other MLPs, which are structured as C-corporations, EMLP is structured as a traditional 1940 Act fund. It was launched in 2012 by First Trust.
EMLP generated a 1.12% return YTD and closed at US$25.34 on February 16, 2022.
Also Read: Virgin Galactic (SPCE) stock soars 30% on ticket sales for space trip

Source - pixabay
Also Read: High-potential metaverse stocks to watch now – MSFT, NVDA to FB
iShares Global Energy (IXC)
Expense ratio – 0.43%
Asset under management (AUM) - US$1.84 billion
50 days daily average volume - 687,537
Total holdings - 49
IXC offers exposure to global energy companies. The global energy market is home to major mega-cap oil and gas companies, so its portfolio has a large-cap bias. It selects companies on a weighted market cap basis. Blackrock launched this open-ended fund in 2021. It tracks the S&P Global 1200 Energy Sector Index.
The IXC generated an 18.12% return YTD and closed at US$33.37 on February 16, 2022.
Also Read: Resonant (RESN) faces probe after stock rallies 248% on Murata’s bid
Fidelity MSCI Energy Index (FENY)
Expense ratio – 0.08%
Asset under management (AUM) - US$1.3 billion
50 days daily average volume - 591,375
Total holdings - 107
The FENY ETF offers exposure to the US energy segment. The top-heavy portfolio reflects more than half held by the top 10 companies. The ETF invests in almost every aspect of the oil and gas industry, including exposure to coal and renewables.
This open-ended fund was launched by Fidelity in 2013. It tracks the MSCI US Investable Market Energy 25/50 Index. FENY generated an 18.19% return YTD and closed at US$18.52 on February 16, 2022.
Also Read: Nvidia (NVDA) posts fourth-quarter profit of US$3 bn on record sales
Bottomline
The S&P 500 Energy Sector Index saw gains of 49.42% in one year. The ETFs offer exposure to different sectors; however, investors should choose ETFs according to their interests.
