


Highlights
- United Parcel Service, Inc. (UPS) will report its Q4, FY21, results on February 1.
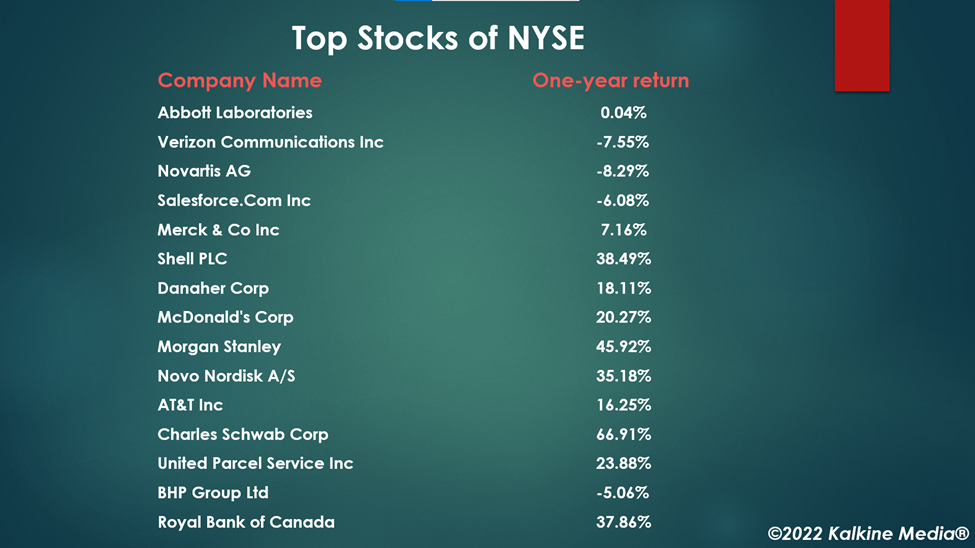
- Charles Schwab Corporation (SCHW) returned 66% gains in the past 12 months.
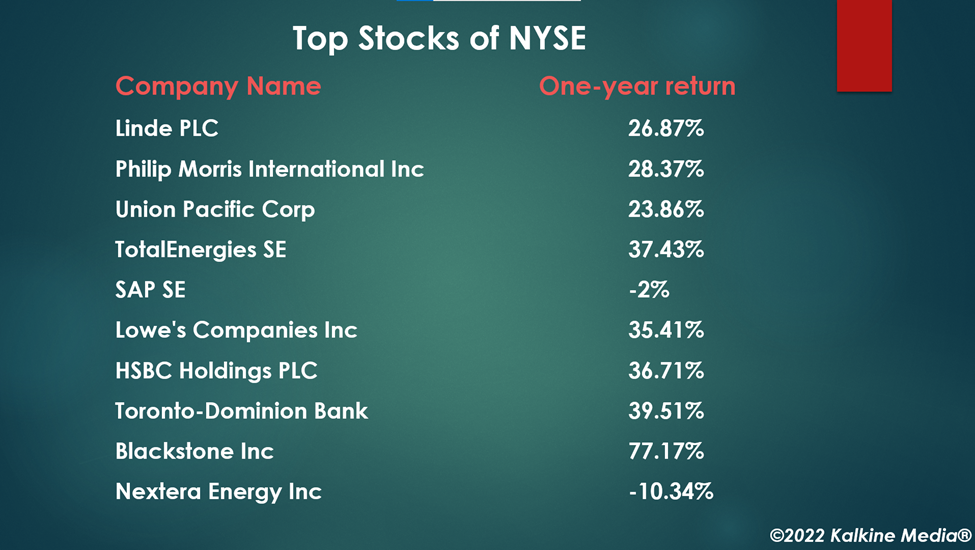
- Linde plc (LIN) will release its Q4, FY21, results on February 10.
The surge in Omicron cases and rate hike worries have weighed on the market lately. The central bank is expected to increase the interest rates several times this year, starting in March.
Economists believe the only way to curb the current high inflation in the US is to tighten the monetary policy. Although the markets began 2022 at a slow pace, there is optimism.
The NYSE Composite Index’s 12.19% growth in the past 12 months, despite the weight of the pandemic, gives hope. Here we explore the remaining stocks on the top 50 NYSE list of companies. Refer to the first part of the article for the other top stocks on the list.
Also Read: What is Terra (LUNA) crypto? All you need to know
Abbott Laboratories (ABT)
Market Cap: US$216.43 billion
Price close on January 27, 2022: US$120.44
One year return: 0.04%
Abbott Laboratories is a medical device and healthcare company based in Chicago, Illinois. It specializes in manufacturing various healthcare products.
The company's sales surged 7.2% YoY to US$11.5 billion in Q4, FY21, while its earnings came in at US$1.98 billion, or US$1.32 per diluted share.
Its P/E ratio is 31.07, the forward P/E for one year is 25.14, the dividend yield is 1.57%, and the annualized dividend is US$1.88.
Verizon Communications Inc. (VZ)
Market Cap: US$217.54 billion
Price close on January 27, 2022: US$51.19
One year return: -7.55%
Verizon is a telecommunication conglomerate firm that offers communication, information, and entertainment services. It is based in New York.
In the fourth quarter of fiscal 2021, the company's net income was US$4.7 billion on revenue of US$34.1 billion, while the fiscal 2021 revenue was US$133.6 billion.
Its P/E ratio is 9.72, the forward P/E for one year is 9.36, the dividend yield is 5.02%, and the annualized dividend is US$2.56.
Also Read: What is Celsius (CEL) token? All you need to know

Source: Pixabay
Novartis AG (NVS)
Market Cap: US$191.04 billion
Price close on January 27, 2022: US$85.14
One year return: -8.29%
Novartis is a Switzerland-based pharmaceutical firm that manufactures prescription drugs, biosimilars, and other related products. It is headquartered in Basel.
In the third quarter of fiscal 2021, the company reported a net income of US$2.75 billion or US$1.23 per share, while its net sales were US$13.03 billion.
Its P/E ratio is 19.72, the forward P/E for one year is 13.49, the dividend yield is 2.47%, and the annualized dividend is US$2.079.
Salesforce.Com Inc (CRM)
Market Cap: US$218.67 billion
Price close on January 27, 2022: US$212.74
One year return: -6.08%
Salesforce is a cloud-based software firm that offers customer relationship management services. It is based in San Francisco, California.
The company's revenue surged 27% YoY to US$6.86 billion in Q3, FY21, while its net income came in at US$468 million.
Its P/E ratio is 122.65, the forward P/E for one year is 87.91, and the EPS is US$1.81.
Merck & Company, Inc. (MRK)
Market Cap: US$203.43 billion
Price close on January 27, 2022: US$80.58
One year return: 7.16%
Merck is a healthcare and pharmaceutical firm based in Kenilworth, New Jersey. It will report its fourth quarter and fiscal 2021 results on February 3, before the opening bell.
In the third quarter of fiscal 2021, the company's sales rose 20% YoY to US$13.15 billion, while its GAAP net income was US$4.56 billion.
Its P/E ratio is 28.46, the forward P/E for one year is 13.94, the dividend yield is 3.49%, and the annualized dividend is US$2.76.
Also Read: Two food stocks to explore in February
Royal Dutch Shell PLC (RDS.B)
Market Cap: US$195.32 billion
Price close on January 27, 2022: US$51.09
One year return: 38.49%
Royal Dutch Shell PLC is an oil and gas company based in The Hague, Netherlands. It explores crude oil and natural gas globally.
In the third quarter of fiscal 2021, the company's net loss attributable to common shareholders was US$447 million on total revenue and other income of US$61.55 billion.
Its P/E ratio is 43.97, the dividend yield is 3.77%, and the annualized dividend is US$1.92.
Danaher Corporation (DHR)
Market Cap: US$198.27 billion
Price close on January 27, 2022: US$269.97
One year return: 18.11%
Danaher is a diversified conglomerate company based in Washington, DC. It manufactures various medical, industrial, and consumer products.
The company's net earnings were US$1.8 billion, or US$2.39 per diluted share in Q4, FY21, while its total sales were US$8.14 billion.
Its P/E ratio is 35.17, the forward P/E for one year is 26.29, the dividend yield is 0.31%, and the annualized dividend is US$0.84.
McDonald's Corporation (MCD)
Market Cap: US$188.83 billion
Price close on January 27, 2022: US$248.74
One year return: 20.27%
McDonald's is a fast-food restaurant chain operator that operates globally. It is based in Chicago, Illinois.
In the fourth quarter of fiscal 2021, the company reported a net income of US$1.63 billion or US$2.18 per diluted share on revenue of US$6.00 billion.
Its P/E ratio is 26.05, the forward P/E for one year is 24.55, the dividend yield is 2.21%, and the annualized dividend is US$5.52.
Morgan Stanley (MS)
Market Cap: US$177.82 billion
Price close on January 27, 2022: US$101.15
One year return: 45.92%
The New York-based Morgan Stanley is a leading investment banking and financial services firm.
The net income applicable to the firm was US$3.7 billion, or US$2.01 per diluted share in Q4, FY21, while its net revenue was US$14.52 billion.
Its P/E ratio is 12.5, the forward P/E for one year is 13.14, the dividend yield is 2.8%, and the annualized dividend is US$2.80.
Also Read: Banks expect Fed to raise benchmark rate by 50 bps in March
Novo Nordisk A/S (NVO)
Market Cap: US$219.02 billion
Price close on January 27, 2022: US$95.44
One year return: 35.18%
Novo Nordisk is a global healthcare and pharmaceutical firm based in Bagsværd, Denmark.
For the nine months ended on September 30, 2021, the company's net profit was DKK 36.86 billion (US$5.52 billion) on net sales of DKK 102.46 billion (US$15.35 billion). (DKK= Danish krone)
Its P/E ratio is 29.96, the forward P/E for one year is 30.11, the dividend yield is 0.83%, and the annualized dividend is US$0.773.
AT&T Inc. (T)
Market Cap: US$176.34 billion
Price close on January 27, 2022: US$24.12
One year return: 16.25%
AT&T is a multinational holding company based in Dallas, Texas. It is one of the world’s leading telecommunication service providers.
For fiscal 2021, the company's net income attributable to common stock came in at US$19.9 billion, or US$2.76 per diluted share on consolidated revenue of US$168.9 billion.
Its P/E ratio is 8.95, the forward P/E for one year is 7.73, the dividend yield is 8.58%, and the annualized dividend is US$2.08.
Charles Schwab Corporation (SCHW)
Market Cap: US$169.09 billion
Price close on January 27, 2022: US$89.7
One year return: 66.91%
Charles Schwab is a financial services firm that provides banking, commercial banking, and other related services. It is based in Westlake, Texas.
On a GAAP basis, the company reported a net income of US$5.85 billion, or US$2.83 per diluted share, on revenue of US$18.52 billion for the year ended on December 31, 2021.
Its P/E ratio is 31.72, the forward P/E for one year is 22.48, the dividend yield is 0.8%, and the annualized dividend is US$0.80.
United Parcel Service, Inc. (UPS)
Market Cap: US$168.92 billion
Price close on January 27, 2022: US$194.83
One year return: 23.88%
United Parcel is a shipping & receiving firm that offers supply management services. It is based in Atlanta, Georgia. The company will report its fourth-quarter fiscal 2021 financial results on February 1, before the market opens.
The company's net income was US$2.32 billion, or US$2.65 per diluted share in Q3, FY21, while its net revenue surged 9.2% YoY to US$23.2 billion.
Its P/E ratio is 26.19, the forward P/E for one year is 16.75, the dividend yield is 2.05%, and the annualized dividend is US$4.08.
Also Read: US GDP grew 6.9% in fourth quarter of 2021, fastest growth in decades
BHP Group Limited (BHP)
Market Cap: US$161.17 billion
Price close on January 27, 2022: US$65.8
One year return: -5.06%
BHP Group is a global resources firm that produces commodities like copper, uranium, precious metals, etc. It is based in Melbourne, Australia.
For the fiscal year ended June 30, 2021, the company's profit was US$13.45 billion on revenue of US$56.92 billion.
Its forward P/E for one year is 10.17, the dividend yield is 12.41%, and the annualized dividend is US$8.00.
Royal Bank of Canada (RY)
Market Cap: US$158.89 billion
Price close on January 27, 2022: US$$111.49
One year return: 37.86%
It is one of Canada's leading banks and financial services firms. It is headquartered in Toronto, Canada.
The company's net income was C$3.89 billion (US$3.04 billion) on revenue of C$12.37 billion (US$9.67 billion) in Q4, FY21
Its P/E ratio is 12.66, the forward P/E for one year is 12.71, the dividend yield is 3.4%, and the annualized dividend is US$3.797.
Linde plc (LIN)
Market Cap: US$159.26 billion
Price close on January 27, 2022: US$311.35
One year return: 26.87%
Linde is an industrial gas company based in Dublin, Ireland. The company will release its fourth-quarter fiscal 2021 results on February 10.
The company's sales rose 12% YoY to US$7.7 billion in Q3, FY21, while its income from continuing operations came in at US$978 million.
Its P/E ratio is 45.76, the forward P/E for one year is 29.37, the dividend yield is 1.37%, and the annualized dividend is US$4.24.
Philip Morris International Inc (PM)
Market Cap: US$159.42 billion
Price close on January 27, 2022: US$102.25
One year return: 28.37%
Philip Morris is a cigarette and tobacco manufacturing firm based in Stamford, Connecticut. It sells its products globally.
The company's net earnings came in at US$2.58 billion, or US$1.55 per diluted share, on revenue of US$8.12 billion in Q3, FY21.
Its P/E ratio is 17.78, the forward P/E for one year is 16.96, the dividend yield is 4.93%, and the annualized dividend is US$5.00.
Union Pacific Corporation (UNP)
Market Cap: US$156.60 billion
Price close on January 27, 2022: US$244.59
One year return: 23.86%
Union Pacific is a transportation company that operates a railroad in the US. It is based in Omaha, Nebraska.
The company reported an income of US$1.7 billion, or US$2.66 per diluted share, on revenue of US$5.7 billion in Q4, FY21.
Its P/E ratio is 24.48, forward P/E for one year is 21.36, the dividend yield is 1.93%, and the annualized dividend is US$4.72.
Also Read: Numeraire (NMR) crypto soars over 40%; know price, performance
TotalEnergies SE (TTE)
Market Cap: US$147.61 billion
Price close on January 27, 2022: US$57.83
One year return: 37.43%
TotalEnergies is an oil and gas company engaged in exploring, producing, and refining chemicals. It is based in Courbevoie, France.
The company's net income came in at US$4.75 billion, or US$1.71 per diluted share in Q3, FY21, while its revenue from sales was US$49.07 billion.
Its P/E ratio is 14, the forward P/E for one year is 8.95, the dividend yield is 3.9%, and the annualized dividend is US$2.226.
SAP SE (SAP)
Market Cap: US$141.39 billion
Price close on January 27, 2022: US$122.38
One year return: -2%
SAP SE is a software company based in Walldorf, Germany. It develops enterprise software for managing business operations and customer relations.
The company reported revenue of €7.98 billion (US$8.90 billion) in Q4, FY21, while its earnings came in at €1.24 (US$1.38) per share.
Its P/E ratio is 20.74, forward P/E for one year is 34.47, the dividend yield is 1.24%, and the annualized dividend is US$1.634.
Lowe's Companies, Inc. (LOW)
Market Cap: US$155.23 billion
Price close on January 27, 2022: US$225.93
One year return: 35.41%
Lowe's is a retail company based in Mooresville, North Carolina. It offers a range of home improvement products for consumers.
The company reported net earnings of US$1.9 billion or US$2.73 per diluted share in Q3, FY21, while its net sales came in at US$22.9 billion.
Its P/E ratio is 20.02, the forward P/E for one year is 18.91, the dividend yield is 1.4%, and the annualized dividend is US$3.20.
HSBC Holdings, plc. (HSBC)
Market Cap: US$142.25 billion
Price close on January 27, 2022: US$35.75
One year return: 36.71%
HSBC is an investment bank and financial services company based in London, UK. It is one of the leading banks in Europe.
The company reported earnings of US$0.17 per diluted share on revenue of US$12.01 billion in Q3, FY21. Its P/E ratio is 12.53, the forward P/E for one year is 9.93, the dividend yield is 3.11%, and the annualized dividend is US$1.09.
Also Read: TIME crypto surged 11% after closing US$30 million funding round
Toronto Dominion Bank (TD)
Market Cap: US$142.06 billion
Price close on January 27, 2022: US$78.95
One year return: 39.51%
Toronto-Dominion is a Canadian banking and financial service company based in Toronto. It offers mortgages, banking, and other related services.
The company reported a net income of US$3.78 billion on revenue of US$10.94 billion for the quarter that ended on October 31, 2021. Its P/E ratio is 12.68, the forward P/E for one year is 12.75, the dividend yield is 3.56%, and the annualized dividend is US$2.816.
Blackstone Inc. (BX)
Market Cap: US$86.64 billion
Price close on January 27, 2022: US$119.04
One year return: 77.17%
Blackstone is an investment management firm based in New York. It is one of the leading firms in real estate investing.
The company's net income was US$2.94 billion on revenue of US$5.76 billion in Q4, FY21. For fiscal 2021, the company's net income was US$12.37 billion on revenue of US$22.57 billion.
Its P/E ratio is 16.72, forward P/E for one year is 23.11, the dividend yield is 3.91%, and the annualized dividend is US$4.36.
Also Read: What is Decentraland (MANA) crypto? All you need to know
NextEra Energy, Inc. (NEE)
Market Cap: US$140.99 billion
Price close on January 27, 2022: US$72.51
One year return: -10.34%
NextEra Energy is an energy company focused on energy infrastructure in North America. It is based in Juno Beach, Florida.
The company reported revenue of US$5.05 billion for the quarter ended December 31, 2021, while its adjusted earnings rose around 4% YoY to US$814 million or US$0.41 per diluted share.
Its P/E ratio is 39.7, the forward P/E for one year is 25.90, the dividend yield is 2.12%, and the annualized dividend is US$1.54.
