


Highlights:
- Alpha Metallurgical Resources, Inc. (NYSE:AMR) has a dividend yield of 1.33% and annualized dividend of US$1.50.
- Cabot Corporation's (NYSE:CBT) dividend yield is 2.34%, with an annualized dividend of US$1.48.
- Mosaic Company (NYSE:MOS) has a P/E ratio of 6.42 and a dividend yield of 1.35%.
The basic material sector comprises companies engaged in discovering and processing raw materials, which are further used in other industries. Metals, paper, concrete, and chemicals are a few examples of basic materials.
This sector is cyclical as the demand for basic materials depends on the overall economic health. In weak economic conditions, the demand falls and vice versa in the robust economic scenario.
Other factors, such as inflation, supply chain issues, unforeseen pandemic situation, or geopolitical conditions, can greatly impact sectoral performance.
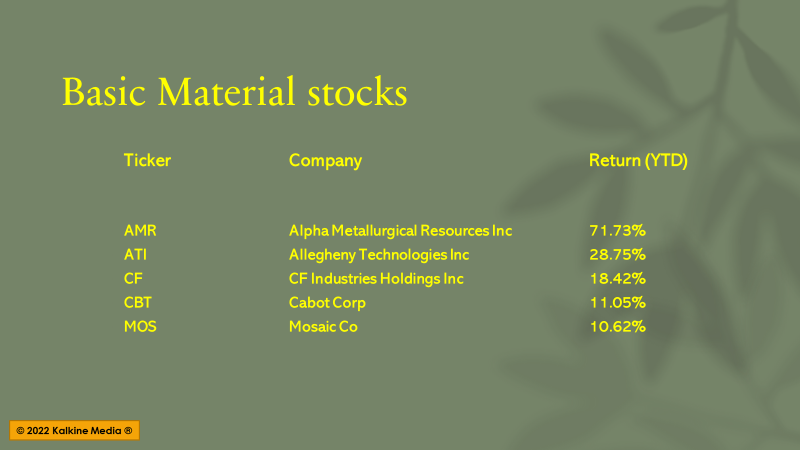
Here, we will discuss five basic material stocks that grew more than 10% year-to-date.
Alpha Metallurgical Resources, Inc. (NYSE:AMR)
Market capitalization: US$2.18 billion
Alpha Metallurgical Resources Inc. is a coal mining company based in Bristol, Tennessee, with mining operations across Virginia and West Virginia. Its portfolio consists of underground and surface mines and coal preparation plants for low-ash metallurgical coal.
AMR’s dividend yield is 1.33%, and the annualized dividend is US$1.50. The stock has a P/E ratio of 3.19, and the forward P/E for one year is 1.28.
The company reported a revenue of US$1.07 billion for the three months ended March 31, 2022, compared to US$0.386 billion in the previous year. Its net income was US$400.9 million or US$20.52 per share diluted compared to the net loss of US$32.9 million or US$1.79 per share diluted in the March quarter of 2021.
It traded in the range of US$186.98 to US$21.28 in the last 52 weeks and closed at US$108.17 on July 6, 2022.
Allegheny Technologies Incorporated (NYSE:ATI)
Market capitalization: US$2.66 billion
Pittsburg, Pennsylvania-based Allegheny Technologies Inc. supplies specialty metals to the end markets, which include aerospace and defense, electrical energy, oil and gas, automotive, etc.
The stock has a forward P/E for one year of 13.70. It traded in the range of US$ $30.74 to US$13.85 in the last 52 weeks.
For the three months ended March 31, 2022, its sales were US$834.1 million, a 20% higher YoY, compared to US$692.5 million in the corresponding quarter the previous year.
The net income attributable to the company came in at US$30.9 million or US$0.23 per share diluted versus the net loss of US$7.9 million or US$0.06 per share diluted in the March quarter of the previous year.
The company has repurchased 3.5 million shares of ATI stock for US$90 million.
The stock closed at US$20.96 on July 6, 2022.
CF Industries Holdings, Inc. (NYSE:CF)
Market capitalization: US$17.8 billion
CF Industries produces and distributes nitrogen fertilizers. This Deerfield, Illinois-based company makes nitrogen by primarily using low-cost US natural gas as its feedstock. Its other products are carbon-free blue and green ammonia used as the hydrogen alternative.
It has a dividend yield of 1.91%, and the annualized dividend per share is US$1.60. The stock has a P/E ratio of 11.02, and the forward P/E for one year is 4.36.
The company generated a net sale of US$2.9 billion for the quarter ended March 31, 2022, compared to US$1.05 billion in the previous year. It booked a net income of US$1.05 billion or US$4.21 per share diluted compared to US$0.175 billion or US$0.70 per share diluted in the March quarter of the previous year.
CF stock traded in the range of US$113.48 to US$43.19 in the last 52 weeks and closed at US$83.59 on July 6.
Cabot Corporation (NYSE:CBT)
Market capitalization: US$3.68 billion
Boston, Massachusetts-based Cabot Corp manufactures chemicals, materials, and chemical-based products. Its three product segments are reinforcement materials, performance chemicals, and purification solutions.
The stock’s dividend yield is 2.34%, and the annualized dividend is US$1.48. It has a P/E ratio of 28.79, and the forward P/E for one year is 10.31.
Its net sales for the quarter ended March 31, 2022, were US$1.09 billion compared to US$0.842 billion in the same quarter the prior year. Its net income attributable to the company came in at US$107 million or US$1.84 per diluted share compared to US$75 million or US$1.30 per share diluted in the March quarter of the previous year.
CBT stock traded between US$78.62 and US$47.59 in the last 52 weeks. It closed at US$63.41 on July 6.
© Gelvol | Megapixl.com
Mosaic Company (NYSE:MOS)
Market capitalization: US$16.35 billion
Mosaic is a leading producer of phosphate and potash, the primary nutrients for the crop. The company is based in Tampa, Florida and has assets in the US, Latin America, and Mexico.
The stock has a P/E ratio of 6.42, and the forward P/E for one year is 3.27. Its dividend yield is 1.35%, and the annualized dividend is US$0.60.
For the quarter ended March 31, 2022, Mosaic’s net sales were US$3.9 billion compared to US$2.29 billion a year ago. It posted a net income of US$1.18 billion, or US$3.19 per diluted share, compared to US$0.156 billion, or US$0.41 per diluted share for the prior year.
The MOS stock closed at US$44.46 on July 6, 2022. It traded in the price range of US$79.28 to US$28.26 in one year.
Bottom line:
Investors must analyze the fundamentals of stocks against the backdrop of current macroeconomic factors to determine a suitable investment option. The market has been volatile this year, and the Federal Reserve’s recent drive to increase interest rates may keep the market jittery in the short term.
