


The JPMorgan Nasdaq Premium Equity (JEPQ) and the Nasdaq 100 Covered Covered Call ETF (QYLD) have grown substantially in the past few years, helped by the rising demand for growth and dividend income.
JEPQ has gathered over $17 billion while the QYLD has attracted $8.1 billion in assets, and the trend will likely continue. This article explains what these active ETFs are, and why the Invesco NASDAQ 100 ETF (QQQM) is a cheaper and better alternative.
JEPQ and QYLD are covered call ETFs
The concept of covered call ETFs has grown dramatically in the past few years, helped by the remarkable success of JEPQ’s cousin, the JPMorgan Premium Equity ETF (JEPI).
The most recent data shows that actively managed funds, which charge a higher fee, have taken over 70% of the fees into US ETFs this year. Data by Morningstar shows that active funds have accounted for 28% of net inflows this year.
Most of these funds rely on the concept of a covered call. The simplest explanation of a covered call is where an investor buys an asset and then sells call options of the same asset, pocketing the premium.
For example, assume that a stock is trading at $10. In this case, a trader can buy the stock and then sell a call option of the same. A call option gives the trader a right but not the obligation to buy the asset.
In this trade, the trader will initially benefit if the stock rises because of the initial investment. If the stock falls, the options trade will become invalid, since the trader can now buy it at a lower price. If this happens, the initial trade will make a loss, which will be partially offset by the premium.
If the stock remains at $10, the trader will still make money in the form of the option premium. On the other hand, if the stock rises, the trader will benefit from the rebound and the premium. However, since the options trade has a strike price, gains will be capped.
JEPQ and QYLD use the same approach to generate returns, which explains why they have a dividend yield of 9.5% and 11.40%, respectively.
JEPQ invests 80% of its funds in companies in the Nasdaq 100 index. The biggest names in the fund are Apple, Nvidia, Microsoft, Meta Platforms, Amazon, and Broadcom. After doing this, it sells call options on equity-linked notes tied to the Nasdaq 100 index.
QYLD has the same strategy, where it invests 80% of its funds in companies in the Cboe Nasdaq 100 BuyWrite V2 Index. This index measures the performance of a theoretical portfolio that holds companies in the Nasdaq 100 index. The fund then sells call options of the index.
Investors love the JEPI and JEPQ ETFs because of their substantial yields, which they pay monthly. At press time, JEPI had a dividend yield of 9.5% while the QYLD yields 11%.
These are substantial yields considering that the 10-year government bonds are yielding 4.095% while the 2-year is yielding 4.0%. This means that a person with a $10,000 investment can make about $110 annually in dividends.
Invesco Nasdaq 100 ETF is a better fund
However, to a large extent, investing passively is a better approach to growing wealth than most active funds. This is what a recent report by the Wall Street Journal noted. It is also what empirical data shows.
In this case, investing in the low-yielding Invesco Nasdaq 100 ETF (QQQM) seems like a better idea.
QQQM, which has a dividend yield of 0.66%, tracks the performance of the Nasdaq 100 index, without using any financial engineering.
It is a sibling to the Invesco QQQ ETF (QQQ), which has almost $300 billion in assets. The main difference is that QQQ has an expense ratio of 0.20% while the QQQM has a smaller ratio of 0.15%. While this is a small spread, I believe that investing in the cheaper asset is a better option.
In most cases, the QQQM ETF provides a better return than the QYLD and the JEPQ funds. That’s because, historically, technology stocks do well in the long term. The Nasdaq 100 index has survived key black swan events in the past like the Covid-19, dot com bubble, and the Global Financial Crisis.
Historical data shows that the QQQM ETF’s stock has risen by 20.4% this year while QYLD and JEPQ have risen by 4.67% and 9.65%. In the last three years, QQQM has risen by 37% while JEPQ has jumped by 7.15%, and QYLD has dropped by 18%.
A stock price return differs from an asset’s total return, which also includes dividends. In the last three years, QQQM’s total return was 40.70%, while JEPQ and QYLD returned 40.2% and 18.80%.
Read more: QYLD vs JEPQ: which is a better Nasdaq covered call ETF?
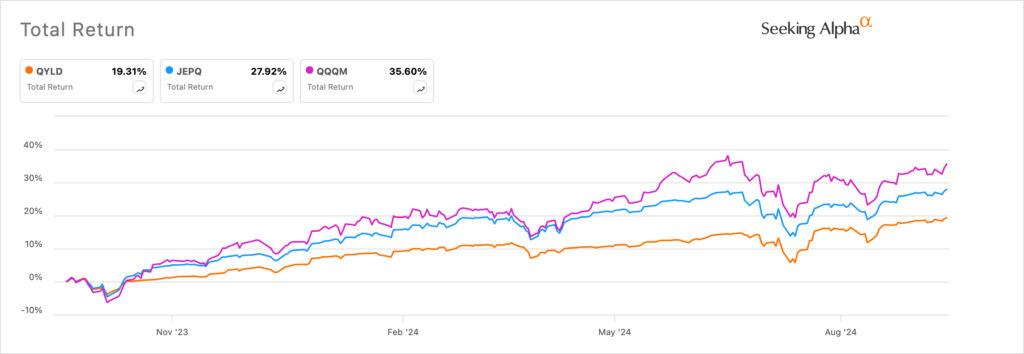
The same has happened in the last 12 months as the QQQM has risen by 35%, while the two have done much less. Therefore, based on the Nasdaq 100’s stronger performance over time, it means that it is a better fund to buy.
The post JEPQ and QYLD are good Nasdaq ETFs: here’s a better alternative appeared first on Invezz
