


Summary
- During the week, the British government announced a package of £30 billion to boost the economy and to deal with job crisis; £3.8 billion of the package to stimulate the housing market through the tax cut.
- Electrocomponents PLC's business performance weakened in Q1 FY2021 due to the lock-down.
- Electrocomponents PLC deferred the final dividend payment for FY2020.
- Travis Perkins's sales slump to one-third in the first three weeks of April 2020 as compared to the same period of last year due to the pandemic mayhem.
- Travis Perkins announced a final dividend of 33.0 pence per share for FY2019.
Given the recent developments, we will review two industrials stocks - Electrocomponents PLC (LON:ECM) and Travis Perkins Plc (LON:TPK). Both stocks are listed on the FTSE-250 Index. Let's review their financial and operational updates to understand the stocks better.
Electrocomponents PLC (LON:ECM) – Underperformed in Q1 FY2021 due to the lock-down
Electrocomponents is a provider of industrial and electronic products to industrial customers and suppliers. The Group operates through the digital and offline sales channel. The Group operates in 32 markets in 80 countries with 12 global distribution centres and more than 7,000 employees.
Q1 FY2021 Trading update (ended 30 June 2020) as reported on 7 July 2020
The like-for-like revenue in Q1 FY21 declined by 11 percent year on year due to the lock-down; however, business activity slightly picked up as the restrictions eased. The digital and RS Pro revenue declined by 12 percent and 3 percent, respectively; the e-procurement revenue underperformed due to a drop in demand from some vital corporate customers. The website revenue performance was in line with the Group's expectation. The cash collection activity remained stable and didn't deteriorate in the current situation. On 2 June 2020, the Group extended the debt facility by £100 million to a total of £450 million; £290 million of the borrowing facility remained undrawn.
FY2020 Annual results (ended 31 March 2020) as reported on 2 June 2020
The Group's like-for-like revenue growth was 2.2 percent year on year to £1,953.8 million. The industrial products revenue was £1,592.5 million, whereas the electronic products revenue was £361.3 million. The revenue addition through the digital and offline channel was £1,229.7 million and £724.1 million, respectively. The board deferred the final dividend payment for FY20 to preserve cash, which was 9.5 pence per share in FY19.
Group Performance in FY2020
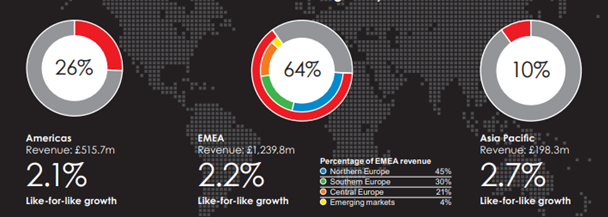
(Source: Company Website)
Key Performance Indicators in FY2020
The like-for-like revenue growth was down to 2.2 percent in FY20 from 8.3 percent in FY19. The adjusted operating profit conversion was 25.8 percent, whereas the adjusted operating profit margin was 11.3 percent. The adjusted earnings per share improved from 37.0 pence in FY19 to 37.7 pence in FY20. The return on capital employed (ROCE) declined to 22.9 percent from 27.7 percent a year ago. The adjusted operating cash flow conversion was 62.1 percent.
Share Price Performance
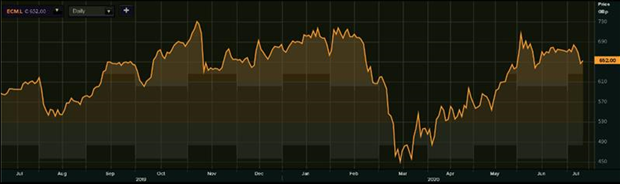
1-Year Chart as on July-10-2020 after the market closed (Source: EODHD/Others, Thomson Reuters)
Electrocomponents PLC's shares closed trading GBX 652.00 per share (as on 10 July 2020). Stock 52-week High and Low were GBX 731.20 and GBX 397.30, respectively. The Group had a market capitalization of £2.92 billion.
Business Outlook
The focus of the Group is to preserve cash and run the operations smoothly in the current scenario. The Group is working on strategic initiatives to gain the market share efficiently. The Group would design and innovate products to gain a competitive advantage. The Group is currently investing in expanding the distribution centres in Germany and the Americas that would have robotics and automation systems which are going to enhance the supply chain. The investment is part of the Destination 2025 strategy of the Group; a five-year plan to gain the market share.
Travis Perkins PLC (LON:TPK) – Provided essential services to NHS and domestic homes during lock-down
Travis Perkins is engaged in the distribution of building materials in the UK. The Group serves to residential, commercial and infrastructure market both in the new build and repair & maintenance category. The Group has four business divisions: Merchants, Toolstation, Plumbing & Heating and Retail. The Group has 1,800 branches with over 30,000 people. The Group is based in the UK and was listed on the London Stock Exchange in the year 1986.
Q1 FY2020 Trading update (ended 31 March 2020) as reported on 28 April 2020
The Group served customers through non-contact channels from the end of March due to the lock-down. Few of the merchant and plumbing & heating branches were operational during lock-down to cater to the essential construction programmes. The Group provided the necessary services such as construction at NHS buildings and hospitals, critical repair work at the homes and the maintenance of the national infrastructure. Group sales in the first three weeks of April 2020 were almost one-third of that generated in the same period last year. The cash collection in Q1 FY20 was supportive, and the Group opened new merchant branches. As on 24 April 2020, the cash balance was £522 million whereas revolving credit facility of £400 million remained fully drawn.
FY2019 Annual results (ended 31 December 2019) as reported on 3 March 2020
The Group reported revenue of £6,956 million, which increased by 3.8 percent on a like-for-like basis. The performance was driven by the outperformance of the merchant division; toolstation also did well. The statutory operating profit improved to £232 million from a loss of £22 million due to £246 million of goodwill impairment in FY18. As on 31 December 2019, the net debt of the Group was £344 million. The merchant segment revenue was £3,703 million, with a like-for-like growth was 3.3 percent. The like-for-like revenue growth for retail and toolstation was 8.6 percent and 16.3 percent to £1,342 million and £445 million, respectively. Plumbing & heating revenue declined by 1.7 percent to £1,465 million. The Group announced a final dividend of 33.0 pence per share that reflected a full-year dividend of 48.5 pence per share.
Key Performance Indicators in FY19
The adjusted operating profit increased from £375 million in FY18 to £442 million. The like-for-like sales growth was 3.8 percent, which declined from 4.9 percent in FY18. The leverage that is the ratio of net debt to EBITDA was 2.5x; leverage ratio indicates the ability of the Group to service debt. The free cash flow improved from £168 million in FY18 to £195 million in FY19. The return on capital employed (ROCE) was 10.1 percent.
Revenue Growth
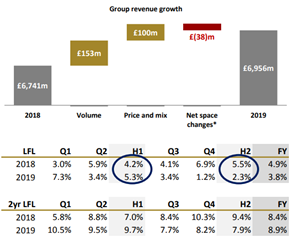
(Source: Company Website)
Share Price Performance
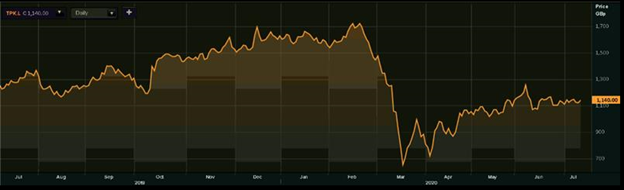
1-Year Chart as on July-10-2020 after the market close (Source: EODHD/Others, Thomson Reuters)
Travis Perkins PLC's shares closed trading GBX 1,140.00 per share (as on 10 July 2020). Stock 52-week High and Low were GBX 1,841.00 and GBX 573.80, respectively. The Group had a market capitalization of £2.87 billion.
Business Outlook
The Group's main priority remains regeneration and successful demerger of Wickes, which is expected to be completed in Q2 FY20. The Group withdrew the market guidance given the current uncertainty, and it is not able to assess the trading. The underlying performance of the Group is highly dependent on the recovery of the economy. The Group aims to deliver sustainable returns to the shareholders.
