


Summary
- Bunzl PLC's covid-19 related products generated revenue of £1,040 million in H1 FY2020.
- Bunzl PLC reported an increase in earnings per share of 16.1 percent year on year in H1 FY2020.
- Bunzl PLC would complete the acquisition of MCR Safety in August 2020.
- Studio Retail Group PLC reported revenue of £514.8 million for FY2020.
- Studio Retail Group PLC's Product sales increased by 42 percent year on year for the first 20 weeks of FY2021.
- Studio Retail Group PLC's has put Education division for conditional sale to Yorkshire Purchasing Organization.
Bunzl PLC (LON:BNZL) & Studio Retail Group PLC (LON:STU) are FTSE listed stocks. BNZL is an industrial stock and STU is a consumer stock. The shares of BNZL and STU were up by around 99.11 percent and 63.57 percent, respectively from their 52-week low. The shares of BNZL were up by approximately 0.24 percent, and shares of STU were down by about 5.76 percent, respectively from their previous closing price (as on 25 August 2020, before the market close at 12:20 PM GMT+1).
Bunzl PLC (LON:BNZL) – Plans to repay employee-related government assistance
Bunzl PLC is a UK based group that is engaged in the supply of customized solution to B2B customers. The Group caters to the foodservice, healthcare, safety, grocery and cleaning & hygiene sectors. Bunzl PLC is included in the FTSE 100 index.
H1 FY20 results (ended 30 June 2020) as reported on 24 August 2020
(Source: Group website)
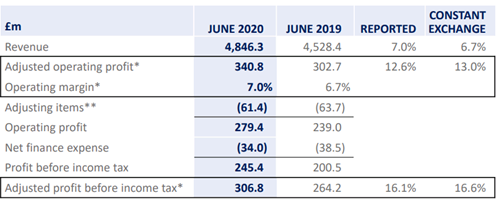
The Group reported revenue of £4,846.3 million, which increased by 7 percent year on year from £4,528.4 million in H1 FY19. The increase in revenue was underpinned by the acquisitions, sale of covid-19 related products and one additional trading day in H1 FY20. The sales for covid-19 associated products such as masks, sanitizers, face shield were close to £1,040 million in H1 FY20 that were £410 million in H1 FY19. Adjusted profit increased by 12.6 percent year on year to £340.8 million in H1 FY20 from £302.7 million in H1 FY19. Adjusted profit before tax was £306.8 million, which increased by 16.1 percent year on year from £264.2 million in H1 FY19. The adjusted earnings per share increased to 70.1 pence per share in H1 FY20 from 60.4 pence per share in H1 FY19. The average return on operating capital increased from 36.9 percent in H1 FY19 to 39.7 percent in H1 FY20. The return on the invested capital increased to 14.4 percent in H1 FY20 up from 13.6 percent in H1 FY19. The net cash inflow was £143.4 million with cash conversion of 112 percent. As on 30 June 2020, Bunzl PLC had net debt of close to £1,665.9 million.
Regional Performance in H1 FY2020
The North America segment reported revenue of £2,728.4 million, which increased by 1.5 percent year on year at constant exchange rate and the operating profit was £154.2 million with an operating margin of 5.7 percent. Continental Europe revenue was £1,088.7 million that grew by 20 percent year on year on constant currency. Adjusted operating profit was £123.9 million that reflected an operating margin of 11.4 percent. UK & Ireland generated revenue of £626.1 million, which increased by 3.8 percent year on year at constant exchange rate. The adjusted operating profit for the UK & Ireland segment was £602.5 million with an operating margin of 4.7 percent.
Share Price Performance Analysis
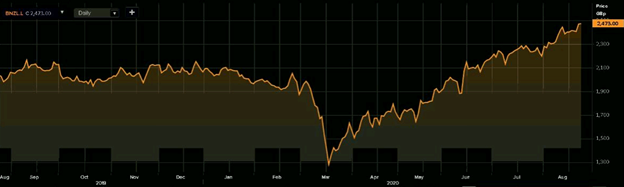
1-Year Chart as on August-25-2020, before the market close (Source: EODHD/Others, Thomson Reuters)
Bunzl PLC's shares were trading at GBX 2,473.00 and were up by close to 0.24 percent against the previous closing price (as on 25 August 2020, before the market close at 12:20 PM GMT+1). BNZL's 52-week High and Low were GBX 2,508.49 and GBX 1,242.00, respectively. Bunzl PLC had a market capitalization of around £8.31 billion.
Business Outlook
The Group benefitted from the exposure to diversified business sectors. It expects that the business conditions would remain challenging in H2 FY20. It has guided that it would complete the acquisition of MCR safety, a Memphis Tennessee based company with yearly revenue of USD 248 million, in August 2020. The purchase of Abco Kovex is under review by the Irish competition authority. Bunzl PLC also plans to repay the government support it took for the employee-related expense and settle the tax deferrals. The focus to drive growth is selling more to existing customers by expanding the product range and also winning new customers.
Studio Retail Group PLC (LON:STU) – Robust demand for electrical and home products during the lockdown
Studio Retail Group PLC is a UK based group that offers products such as clothing and homeware. The Company's operation is categorized under Studio and Findel Education. Studio Retail PLC is included on the FTSE All-Share index.
FY2021 trading update
The Product sales increased by 42 percent year on year for the first 20 weeks of FY21; however, the sales have subsided after the reopening of the high-street stores. The home and leisure items witnessed incredible demand in the Product segment with demand for electrical and home goods up by 95 percent and 58 percent, respectively year on year. The growth for the clothing and footwear product was up by 6 percent year on year.
FY2020 results (ended 27 March 2020) as reported on 24 August 2020
In FY20, the Group reported revenue of £514.8 million, which increased by 2.2 percent year on year from £503.7 million in FY19. The revenue from continued operations was £434.9 million, which increased from £421.7 million a year ago. Operating profit from the continued operation was £14.7 million, which declined by 52.7 percent year on year following the impact of bad debt charge of £20.0 million related to covid-19. The profit before tax from the continued operation was £6.8 million. As on 27 March 2020, Studio Retail had net debt of £5.6 million. In FY20, the customer base was more than 2.0 million, and average customers spend of around £165. The online ordering was about 90 percent of the total orders.
Performance by Business Activity in FY2020
(Source: Group website)
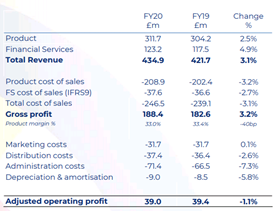
Studio, the online value retail business, generated revenue of £434.9 million, which increased by 3.1 percent year on year. Under the Studio business, Product revenue increased by 2.5 percent year on year to £311.7 million and Financial Services revenue increased by 4.9 percent year on year to £123.2 million in FY20. Adjusted operating profit was £39.0 million for Studio. Education business is under consideration for sale to Yorkshire Purchasing Organization for £50.0 million after obtaining clearance from CMA. The deal for sale was announced in December 2019. Education that is reported under discontinued operations reported revenue of £79.9 million in FY20.
Share Price Performance Analysis
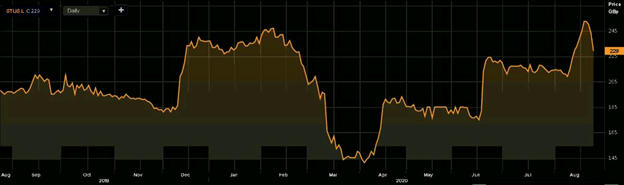
1-Year Chart as on August-25-2020, before the market close (Source: EODHD/Others, Thomson Reuters)
Studio Retail Group PLC's shares were trading at GBX 229.00 and were down by close to 5.76 percent against the previous closing price (as on 25 August 2020, before the market close at 12:20 PM GMT+1). STU's 52-week High and Low were GBX 265.00 and GBX 140.00, respectively. Studio Retail Group PLC had a market capitalization of around £210.06 million.
Business Outlook
The Group highlighted the challenges during the pandemic, and it is focused to cater to customers through the digital channel. It is willing to expand the customer base through credit offers. It is confident of earning medium-term profit growth. The medium-term target of the Group is to expand the customer base to 3 million and earn revenue of £1 billion. The Company would invest in marketing to drive retail profitability.
