AUS
AUS
 NZ
NZ
 UK
UK
 CA
CA
 USA
USA
 IND
IND





 Clarkson PLC (LON:CKN)
London, the United Kingdom-based Clarkson Plc is among the market leader in providing services related to integrated shipping to their clients internationally. The company is having around 50 offices in 20 plus countries around the globe and is having a representative base of more than 1,500 professionals. CKN-Recent News
The companyâs former Chair and Independent Non-Executive Director, James Hughes passed away on 12th October 2019.
CKN-Business performance for H1 FY19 period ended 30th June 2019

(Source: Companyâs filings, London Stock Exchange)
The companyâs total revenue stood at £167.8 million in the first half of the financial year 2019 as against £152.6 million in the first half of the financial year 2018. This increase in revenue was driven by an increase in revenue from Broking and support businesses.
The companyâs underlying operating profit was at £20.9 million in the first half of the financial year 2019 versus £18.8 million in the first half of the financial year 2018. The reported operating profit stood at £20 million in the first half of the financial year 2019 versus £17.6 million in the first half of the financial year 2018.
The companyâs underlying PBT (Profit before tax) stood at £20.1 million in the first half of the financial year 2019 versus £19.2 million in the first half of the financial year 2018. The reported PBT stood at £19.2 million in the first half of the financial year 2019 versus £18 million in the first half of the financial year 2018.
The reported Profit stood at £14.8 million in the first half of the financial year 2019 versus £13.6 million in the first half of the financial year 2018. The companyâs reported basic earnings per share stood at 46.2 pence in the first half of the financial year 2019 versus 42.5 pence in the first half of the financial year 2018. The companyâs reported diluted earnings per share were at 46.1 pence in the first half of the financial year 2019 versus 42.3 pence in the first half of the financial year 2018. The company had shown decent financial performance for the first half of the financial year 2019. Both the top-line and the bottom-line performance has slightly improved for the period.
CKN-Stock price performance

(Source: Thomson Reuters) Daily Chart as on Dec-27-19, before the LSE market close
The market capitalisation of the company while writing as on 27th December 2019 (at 12:12 PM GMT) was approximately £906.51 million.
While writing, Clarkson Plcâs shares were trading at GBX 3,000.00 per share; which were 0.50 per cent up in comparison to the previous day closing price level.
The shares of the Clarkson Plc have struck a high of GBX 3,015.00 (as on December 27, 2019) and a low of GBX 1,834.00 (as on December 28, 2018) in the last twelve months. At the current price point, as quoted in the price chart, the companyâs shares were trading 0.50 per cent below the high price point attained in the last twelve months and 63.58 per cent above the low price point attained in the last twelve months.
At the time of writing, the stock's average daily traded volume for 5 days was 54,998.40; 30 days- 29,637.97 and 90 days â 34,616.76. The 5 days daily average traded volume of the shares of the company was up by 85.57 per cent in comparison to 30 days daily average traded volume. The shares of the company were trading above the 30-days and 60-days SMA while writing.
On a YTD (Year-to-Date) time interval, the shares of Clarkson Plc surged by approximately 57.11 per cent and were up by 27.56 per cent in the last quarter. However, Clarkson Plcâs shares have delivered 8.74 per cent positive return in the last one-month period.
Â
BT Group PLC (LON: BT.A)
BT Group PLC is a fixed-line telecommunication company, based out of London. The company was incorporated in 1846 and trace back its existence to the Electric Telegraph Company, being the world's oldest communications group. BT was the first group to build a countrywide communications network. It is serving clients across 180 countries.
BT.A-Recent News
The company accelerated its global transformation as it reached an agreement for the sale of its Spanish managed ICT services business to Portobello Capital. However, this transaction is expected to finalise in the first half of 2020 and awaits approval from regulatory authorities.
BT.A-Business performance for H1 FY20 period ended 30th September 2019

(Source: Companyâs filings, London Stock Exchange)
The companyâs reported revenue decreased by 1 per cent to £11,467 million in the first half of the year 2020 as compared with the corresponding period of the last year, because of regulation, strategically reducing low margin business, and decline in the legacy products.
Adjusted revenue was down by 2 per cent to £11,413 million in the first half of the year 2020. In the first half of the year 2020, the profit before taxation was almost the same of the corresponding period of the previous year, while adjusted EBITDA reduced by 3 per cent to £3,923 million, driven by an increase in the content costs, spectrum fees, and investment to enhance competitive positioning.
Basic earnings per share surged by 2 per cent to 10.8 pence against the same period in 2018. Net cash inflow from operating activities stood at £2,173 million in the first half of the year 2020; normalised free cash flow was down by 38 per cent to £604 million, driven by the increased capital expenditure, higher interest and tax payments, partly offset by one-off cash flows. Capital expenditure was up by 3 per cent to £1,882 million, due to the increased network investment. The interim dividend per share was 4.62 pence and remained the same as of the previous year same period data.
BT.A-Stock price performance
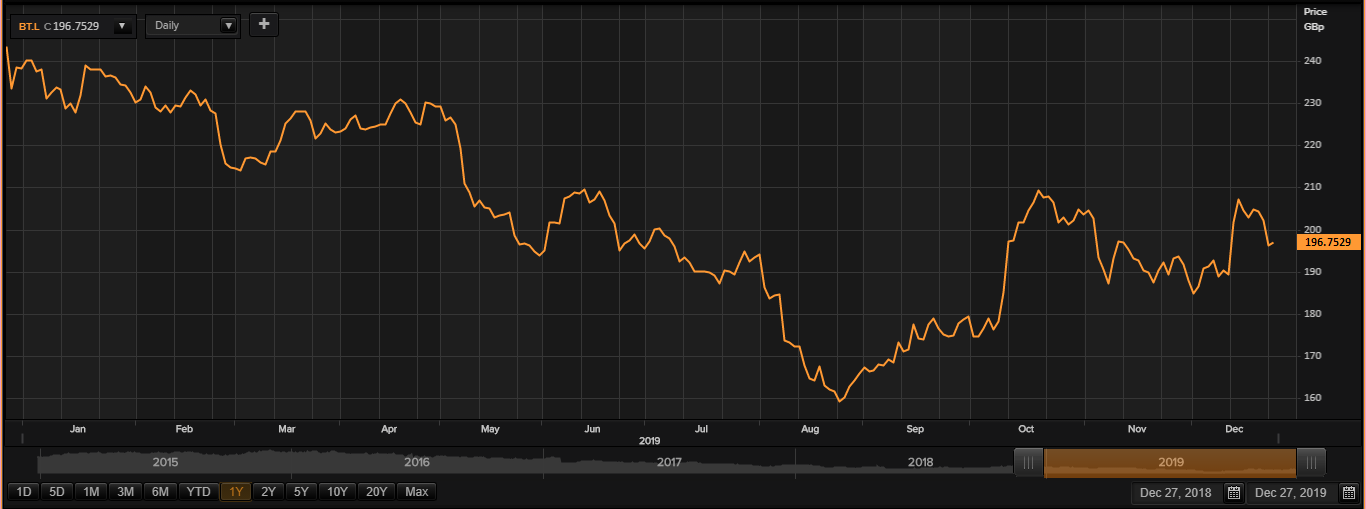
(Source: Thomson Reuters) Daily Chart as on Dec-27-19, before the LSE market close
The market capitalisation of the company while writing as on 27th December 2019 (at 12:41 PM GMT) was approximately £19.37 billion.
While writing, BT Groupâs shares were trading at GBX 196.75 per share; which were 0.38 per cent up in comparison to the previous day closing price level.
The shares of the BT Group have struck a high of GBX 242.67 (as on December 27, 2018) and a low of GBX 157.67 (as on August 27, 2019) in the last twelve months. At the current price point, as quoted in the price chart, the companyâs shares were trading 18.92 per cent below the high price point attained in the last twelve months and 24.79 per cent above the low price point attained in the last twelve months.
At the time of writing, the stock's average daily traded volume for 5 days was 21,572,233.40; 30 days- 22,598,396.07 and 90 days â 23,376,825.37. The 5 days daily average traded volume of the shares of the company was down by 4.54 per cent in comparison to 30 days daily average traded volume. The shares of the company were trading above the 30-days and 60-days SMA while writing.
On a YTD (Year-to-Date) time interval, the shares of BT Group plunged by approximately 17.68 per cent and were up by 12.03 per cent in the last quarter. However, BT Groupâs shares have delivered 3.06 per cent positive return in the last one-month period.