


_07_03_2026_03_50_21_133108.jpg)

When we talk about diversifying stocks in portfolio, it becomes equally important to choose stocks from diverse sectors as it is to pick different stocks. Here we are going to discuss two stocks with exposure in various themes or segments.
Sports Direct International PLC
The Sports Direct International PLC (SPD) retail chain was formed in the year 1982; headquartered in London, the United Kingdom, is a well-known supplier of retails sports, footwear, leisure clothing, apparel and equipment products through a network of retail stores and online channels. Its business engagement is in five segments: European Retail, Wholesale & Licensing, UK Sports Retail, Rest of World Retail, and Premium Lifestyle. The companyâs business operations are spread across 20 countries and have a total headcount of around 26,500 staff.
On 12th December 2019, the company will announce the interim results.
Recent News
On 11th September 2019, the group, participants of the 2011 Share Scheme had been earlier guaranteed a minimum of £3 per share awarded to applicants of the scheme. This quantum was increased to a minimum of £4 per share for an eligible employee who chose to delay vesting until 2018. The group announced that for any employee eligible who stays in the scheme, the minimum price would be enlarged to £5 per share.
On 11th September 2019,
Sports Direct had been put into an embarrassing situation recently when its auditor, Grant Thornton, left after ten years of association with the company and now the company faces a challenging legal deadline. Its annual general meeting and the law said that the company must have an auditor in place of Grant Thornton. If the company does not find a willing taker within seven days, then it will become the 1st major UK-listed business to fail to assign an auditor and be pushed to accept one chosen by the government. The company had no success in finding a replacement, despite various efforts to attract big auditors in the town.
The problems of the company started in July 2019, from much-delayed results, which showed an unanticipated tax bill of £624 million owed to authorities in Belgium, and the company had a substantial downward impact on its share price.
Share Buy-Back Programme (as on 11th September 2019)
The group announced its intention to start a new share buyback programme from September 12, 2019 for the period up to October 25, 2019 (both dates included). This programme aims to decrease the share capital.
With Liberum Capital Limited, will be conducting the programme on the group's behalf the company as per an agreement entered by the two companies and it will make trading decisions in the programme independently. Of all shares, the average purchase price acquired in this programme will be less than £30 million and the maximum number of shares that can be purchased will be 10 million ordinary shares.
Financial Highlights for FY2019 (£ million)
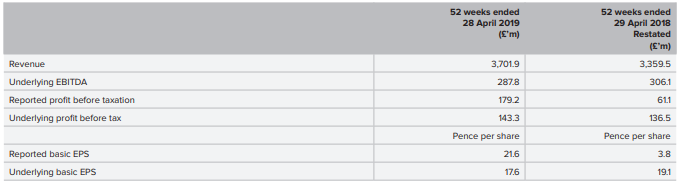 (Source: Annual Report of the company)
The companyâs revenue in the financial year 2019, improved by 10.2 per cent to £3,701.9 million as compared with the previous year. UK Sports Retail, including USC fascia sales, revenue rose by 0.3 per cent to £2,187.3 million against the last year. European Sports Retail, including the Heatons Republic of Ireland, revenue reduced by 5.9 per cent to £599.8 million. Premium Lifestyle revenue climbed by 26.3 per cent, with revenue in the Wholesale & Licensing division decreasing by 12.2 per cent. In Rest of World Retail, revenue was up by 12.2 per cent to £215.9 million. Since the acquisition, House of Fraser sales stood at £330.6 million.
The companyâ gross margin in the year 2019 surged by 310 bps to 42.8 per cent against the 39.7 per cent in FY18. This was primarily driven by the price resetting, adjustments in the previous year relating to acquisition accounting as a result of the assets of Eastern Mountain Sports and Bobâs Stores and purchase of the trade, and previous year surged inventory provisions as all segments invested in more substantial product offerings.
In FY19, operating costs surged by 26.1 per cent to £1,287.1 million as compared with the financial year 2018 of £1,020.3 million, due to the addition of House of Fraser overheads. The company underlying EBITDA (pre-Share Scheme costs) for the year 2019 decreased by 6 per cent to £287.8 million as compared to £306.1 million in FY18.
Group underlying profit before tax rose by 5 per cent to £143.3 million in FY19, driven by the addition of House of Fraser, but offset by lower amortisation and depreciation charges.
During the year 2019, the company generated free cash flow of £273.3 million, a decrease from £326.2 million in FY18.The net debt reduced by £18.6 million to £378.5 million in FY19. Net debt/reported EBITDA stood at 1.3x in FY19.
Outlook
The company remains very optimistic about delivering high growth. In the year 2019, the company will see several significant milestones being achieved, through the Flannels flagship store beginning and will begin the work to form the Frasers Glasgow store.
The company is further planning to use debt refinancing options to meets its operational expenditures. The company would like to look at some certainty and stability entering the broader economic environment.
The company has shown a decent growth, but they also witnessed the significant challenge that House of Fraser brings, so they are cautious about the upcoming year. If House of Fraser is to be a viable ongoing entity, alongside another high street, the United Kingdom retailers the company called on the government to overhaul the antiquated rates system. The core business in the United Kingdom, which drives the overall profitability will remain a firm foundation, and the company is hopeful that the overseas businesses will continue to increase the performance.
Stock Price Performance
 Daily Chart as on 12-September-19, before the market close (Source: Thomson Reuters)
On 12 September 2019, while writing the report (at 10:15 am GMT, before the market close), stock of SPD was trading at GBX 272.40, which was up by 2.87 against the previous day closing price. Stock's 52 weeks High and Low is GBX 358 and GBX 166.60 respectively. The companyâs stock beta was 0.45, reflecting less volatility as compared to the benchmark index. The outstanding market capitalisation was around £1.40 billion.
Taylor Wimpey PLC
Taylor Wimpey PLC is a residential housing developer based in UK. The company has operations at a regional level, and it operates from 24 local offices all over the country. It builds a wide array of properties and is recognised as one of the United Kingdomâs largest residential developers. The groupâs operations are differentiated in two segments: Housing Spain and the Housing United Kingdom. The Housing United Kingdom division is then further divided into London and South East (including Central London) Central and South West, North, and Corporate.
On 13th November 2019, the company will announce the trading update.
Financial Highlights for H1 FY2019 (£ million)
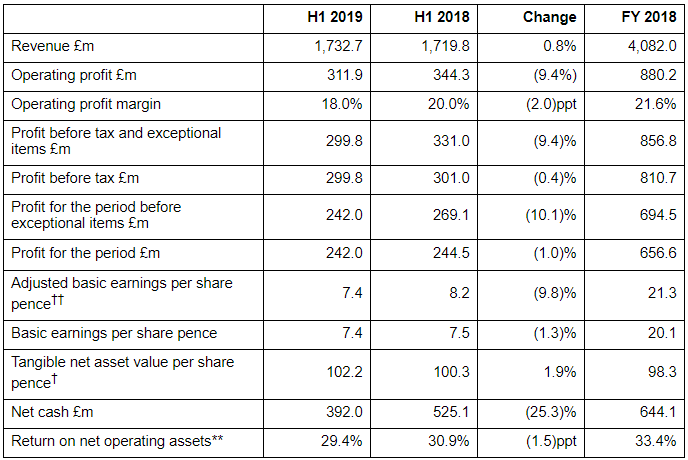 (Source: Interim Results of the company)
In the H1FY19, the companyâs revenue increased by 0.8 per cent to £1,732.7 million versus £1,719.8 million in H1 FY2018. In H1 FY2019, the company completed 6,541 homes versus 6,497 homes in H1 FY2018. The companyâs Profit before tax (PBT) declined marginally to £299.8 million in H1 FY2019 as compared to £301.0 million in H1 FY2018. The Profit for the period was £242 million as against £244.5 million in H1 FY2018. On 30th June 2019, the net cash stood at £392 million versus £525.1 million as at 1st July 2018, driven by the investment in work in progress and timing of land payments, showing the rise in the order book.
UK Operations
In H1 FY2019, net private sales rate stood at one, over an average of 257 outlets. On 30th June 2019, the robust order book was of 10,137 homes (1st July 2018: 9,241 homes), an increase of 10 per cent, through a value of £2,366 million (1st July 2018: £2,175 million), an increase of 9 per cent, which is excluding joint ventures. The company had a recommendation score of 89 per cent as measured by the NHBC (National House-Building Council) survey on behalf of the HBF (Home Builders Federation). Also, there was an increase in the average Construction Quality Review score to 4.05. In the first half of 2019, the company contributed £196 million to local communities through the planning obligations. Low employee turnover of 12.9 per cent in FY19 and High employee engagement of 93 per cent in FY19 was reported.
Dividend
The company announced an interim ordinary dividend per share of 3.84 pence versus 2.44 pence in H1 FY18 to be paid on November 2019, bringing total dividend in the year 2019 to £600 million or 18.34 pence per share. In FY20, the special dividend was of 11.0 pence per share or £360 million to be paid in July 2020. Total dividend anticipated to be 18.6 pence per share or £610 million in FY2020.
Outlook
The company had made decent progress in the first half of the financial year 2019. The company saw an increase in the demand for its homes. The housing market conditions remained positive despite the political uncertainties. The company was successful in offsetting the lower margins by posting record sales. The company holds a decent order book.
The suppliers have both increased stocks of imported goods and put in place strategies to source materials from alternative suppliers. The company has a decent balance sheet, helping it to remain agile and respond swiftly to new opportunities. With continued availability of Help-to-Buy, good access to affordable mortgage finance and high employment supporting strong demand for affordable homes, conditions in the latest build UK housing market remains positive.
Share Price Performance
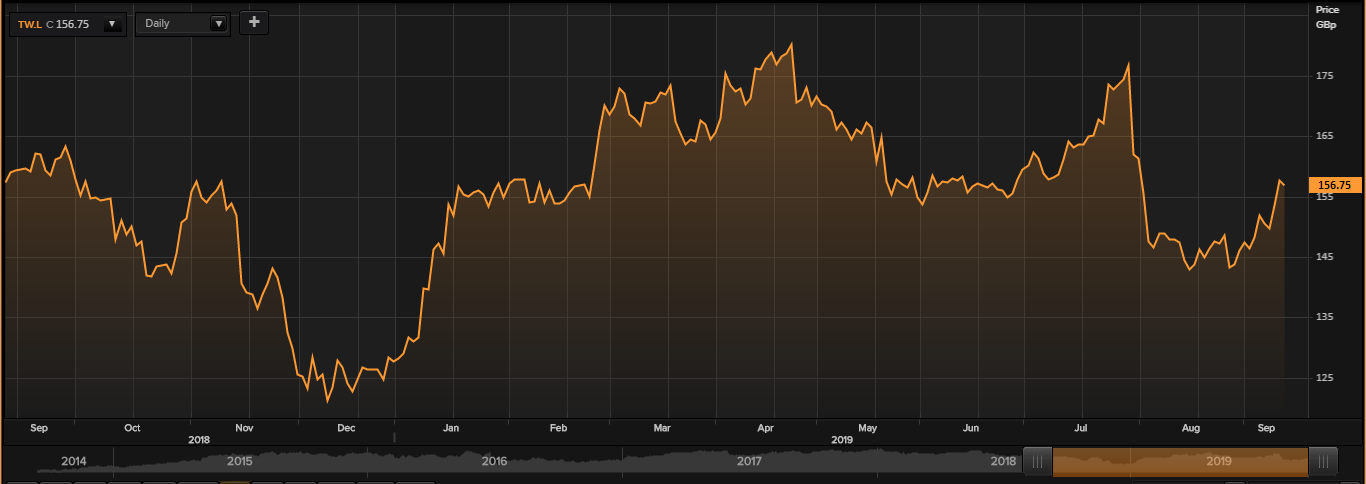 Daily Chart as on 12-September-19, before the market close (Source: Thomson Reuters)
On 12 September 2019, while writing the report (at 10:15 am GMT, before the market close), TW stock was trading at GBX 156.75, which was lower by 0.54 from the closing price of the previous day. Stock's 52 weeks High and Low is GBX 180.51/GBX 119.72. The companyâs stock beta was 1.01, reflecting almost the same volatility as compared to the benchmark index. The outstanding market capitalisation was around £5.18 billion, with a dividend yield of 4.85 per cent.
