


Studio Retail Group Plc
Studio Retail Group Plc (LON:STU), previously also called Findel Plc, is an Accrington, United Kingdom based General retailing company that basically engages in the business of home shopping as well as Education supplies. The company runs its operations through two of its major business divisions which are Studio as well as the Findel Education segment. The studio brand is responsible for the retailing of fashion products, home and leisure goods as well as gifts and toys majorly through the companyâs online store, which also makes up for the largest part of the brandâs turnover. The Findel Education brand is mainly responsible for giving an extensive choice in terms of education from early and primary years to higher education and further studies, if any. Through this brand, the company exports to over 150 countries globally making it one of the largest retailers in this space in the United Kingdom.
STU Financial Performance
On 5th June 2019, the company issued a press release to announce its full year results for the period ended 29th March 2019. The company reported a 5.7 per cent year on year growth in the revenue from £479.6 million in FY 2018 to £506.8 million in FY 2019. The product revenue growth was reported to be at 7.8 per cent, primarily because of the further increase in the active consumer base of the company to 1.9 million as well as higher spends made per customer. The Adjusted operating profit was reported at an increase of 14.4 per cent year on year from £33.6 million in FY 2018 to £38.4 million in FY 2019. The adjusted operating profit margin was reported at a growth of 60 basis points year on year from 7.0 per cent in FY 2018 to 7.6 per cent in FY 2019. The adjusted profit before tax also displayed a rise of 17.7 per cent year on year from £24.4 million in FY 2018 to £28.8 million in FY 2019. There was also an increase of 18.9 per cent year on year reported in the Profit for the year from £19.6 million in FY 2018 to £23.3 million in FY 2019. The most significant highlighting point of the company in terms of its financial performance came from the massive 95 per cent year on year growth in the Cash generated from operating activities which went from £11.4 million in FY 2018 to £22.4 million in FY 2019.
STU Share Price Performance
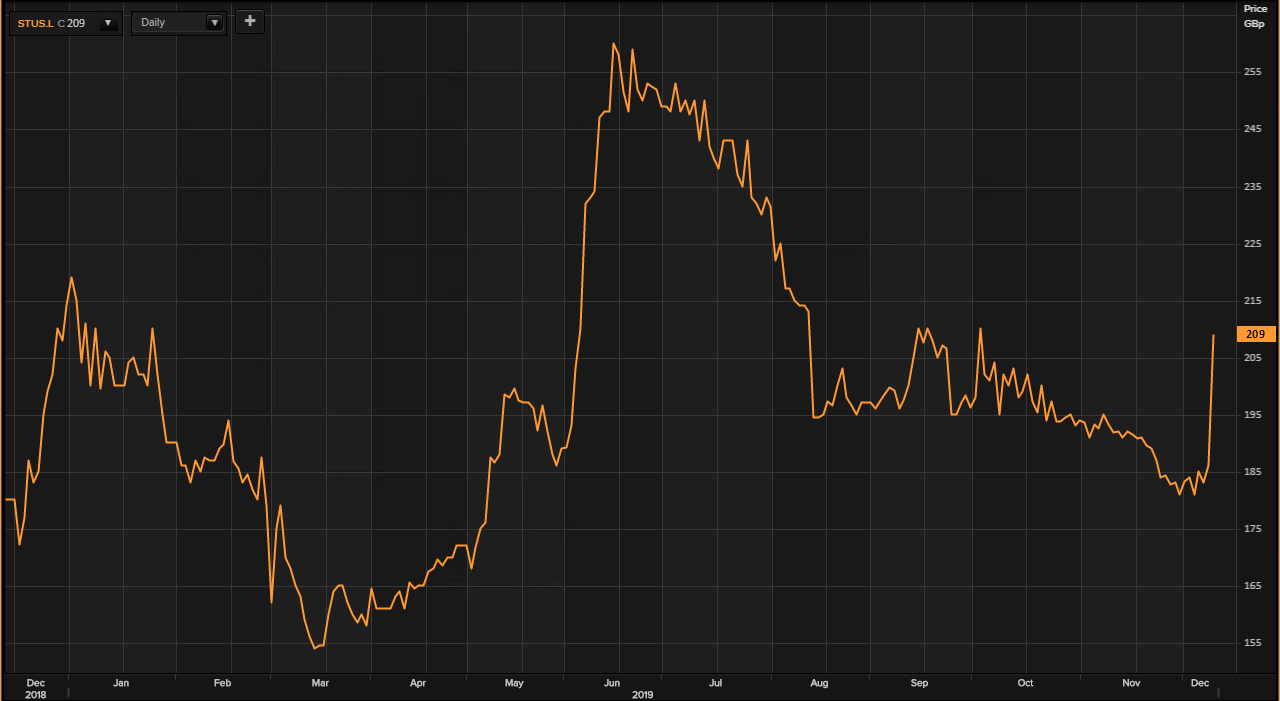
(Source: Thomson Reuters) Daily Chart as on 12-December-19, before the close of the market
As on 12th December 2019, at 08:30 A.M Greenwich Mean Time, at the time of writing this, Studio Retail Group Plcâs price of the Share was reported to have been trading at GBX 209.00 per Share on the London Share Exchange with no change in the price of the share, in comparison with the previous dayâs closing share price, which was also reported to have been at GBX 209.00 per Share.
The beta of the companyâs share has stood at a value of 0.5058. By this, the investors can infer that share price movement of the company, is less volatile, in comparison with the movement of the comparative market index.
TUI AG
TUI AG (LON:TUI) is a Hannover, Germany based company that was formed through the merger of TUI AG and TUI Travel in 2014 and is one of the leading European tour operators with operations spanning across 180 destinations. The company specialises in sales and marketing, as well as holiday experiences. Customers can create their own holiday schedule, choosing their own hotels, cruises and flights thanks to the firmâs own and third-party flying capacity. The groupâs sales division provides over 20 million customers every year with personalised holiday experiences through multiple channels and travel agencies. Further, sales and marketing vertical is the major revenue driver with 44% earnings contribution. Accounting for the rest of earnings are hotel and cruise activities including 380 hotels globally in hotspots such as the Western and Eastern Mediterranean, North Africa, the Caribbean and Egypt. Hotels operate under an ownership, lease, management or franchise model, while TUIâs own brands include Robinson, TUI Magic Life and TUI Blue.
TUI Financial Performance
On 11th December 2019, the company published a press release to announce its full year results ended 30th September 2019. The turnover of the group was reported a year on year growth of 2.5 per cent from â¬18,469 million in FY 2018 to â¬18,928 million in FY 2019. This change was reported to be at 2.7 per cent on constant currency. This revenue growth did not translate into the underlying EBITA performance, as the Underlying EBITA was reported at a significant decline of 24.5 per cent year on year from â¬1,183 million in FY 2018 to â¬893 million in FY 2019. The reported EBITA was also at a decline of 27.1 per cent year on year from â¬1,055 million in FY 2018 to â¬768 million in FY 2019. The earnings before tax was also reported to have plunged by around 28.4 percent year on year from â¬966 million in FY 2018 to â¬691 million in FY 2019. The Underlying earnings per share was reported to have declined by 24.4 per cent year on year from â¬1.16 per share in FY 2018 to â¬0.89 per share in FY 2019. This also led the management of the company to propose a reduced dividend for the year, with the proposed dividend per share at â¬0.54, a negative change of 25.6 per cent year on year. The Net Debt as on 30th September 2019 was reported to be at â¬910 million as opposed to a Net Cash reported as on 30th September 2018 at â¬124 million. The leverage ratio as on 30th September 2019 was at 3.0 times.
TUI Share Price Performance
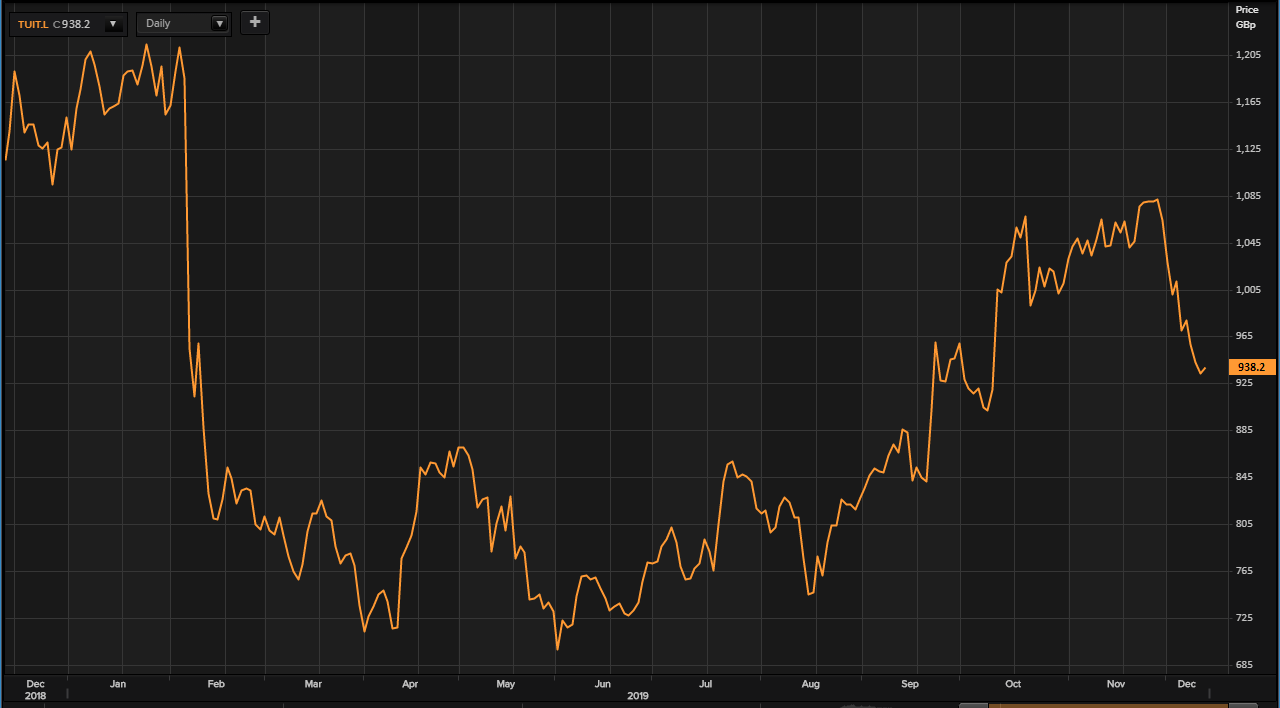
(Source: Thomson Reuters) Daily Chart as on 12-December-19, before the close of the market
As on 12th December 2019, at 08:30 A.M Greenwich Mean Time, at the time of writing this, TUI AGâs price of the Share was reported to have been trading at GBX 938.20 per Share on the London Share Exchange, an increase in the value of 0.54 per cent or GBX 5.00 per Share, as opposed to the last dayâs closing share price, which was reported to have been at GBX 933.20 per Share.
The beta of the companyâs share has stood at a value of 0.9031. By this, the investors can infer that share price movement of the company, is less volatile, in comparison with the movement of the comparative market index.
AA Plc
AA Plc (LON: AA.) is a Basingstoke, United Kingdom based company engaged in the business of providing roadside assistance. Broadly, the company has two segments, which are, Roadside Assistance that provides all kinds of help to people who have been stranded on roads with their automobiles or any mechanical support for peopleâs vehicles at home as well, and second, the Insurance segment, that mainly consists of underwriting motor insurance or any other financial services that are needed for motor vehicles. The company also has a services segment that basically includes a driving school and British school of motoring and DriveTech.
- Trading Update
On 11th December 2019, the company made a press release to announce a trading update as well as an intention to buyback for bonds. The company highlighted that the positive operational performance, reported in the first half year results has continued in the second half of the year and the board of the company expects that the Earnings before Interest Taxes depreciation and Amortization as well as the free cash flow generation would be in line with the anticipations of the market. The company also updated that due to this excellent performance during the period, the company has an intention to buyback some of its outstanding bonds in the market. It was also announced that the results for the full year ending on 31st January 2020 will be announced on 31st March 2020.
- Share Price Performance
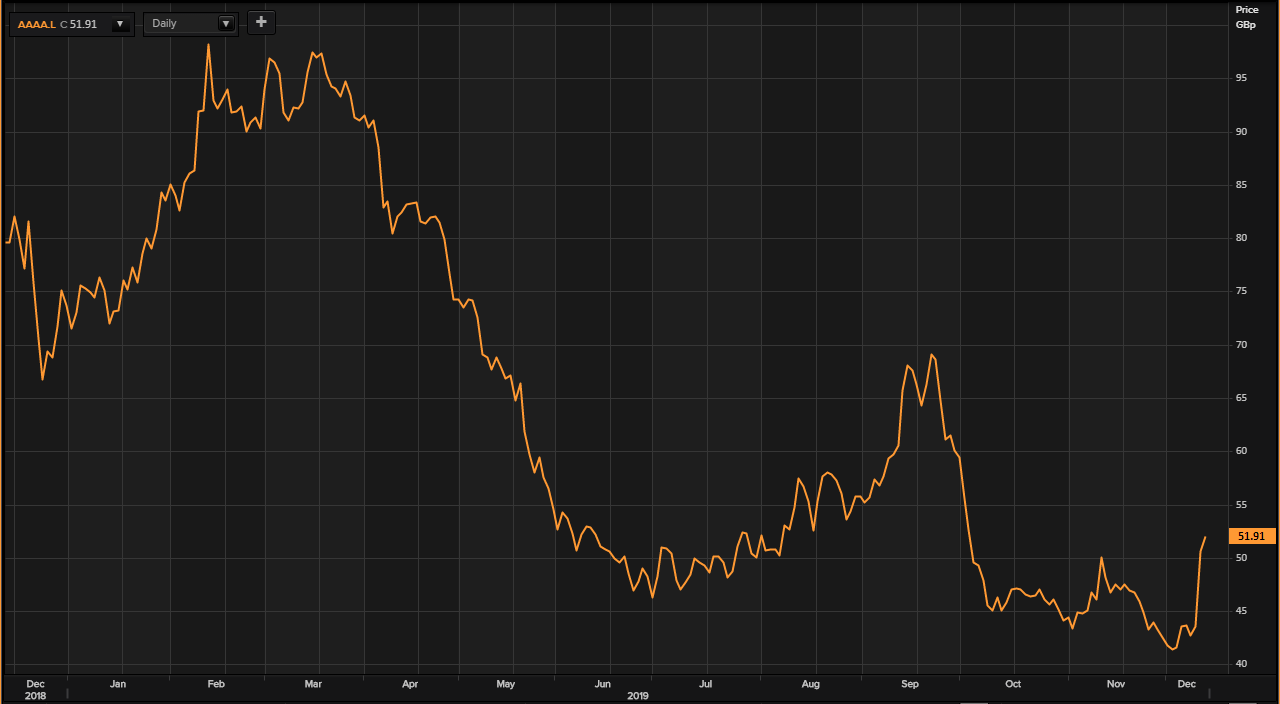
(Source: Thomson Reuters) Daily Chart as on 12-December-19, before the close of the market
As on 12th December 2019, at 08:30 A.M Greenwich Mean Time, at the time of writing this, AA Plcâs price of the Share was reported to have been trading at GBX 51.91 per Share on the London Share Exchange, an increase in the value of 2.79 per cent or GBX 1.41 per Share, as opposed to the last dayâs closing share price, which was reported to have been at GBX 50.50 per Share.
The beta of the companyâs share has stood at a value of 1.9638. By this, the investors can infer that share price movement of the company, is more volatile, in comparison with the movement of the comparative market index.
