


RSA Insurance Group Plc Results for FY19
(Source: Companyâs filings, London Stock Exchange)
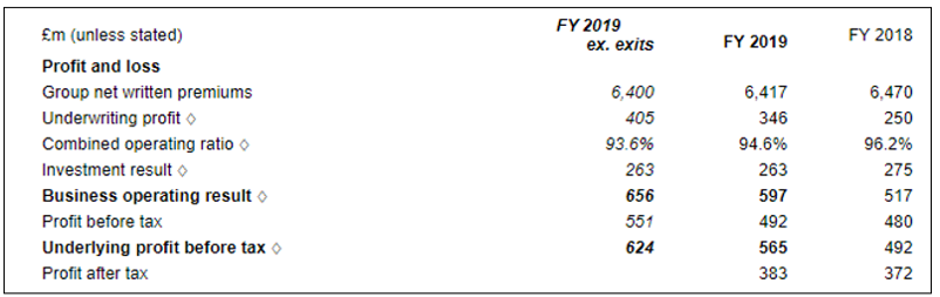
The Net written premiums of the company stood at £6,417 million during 2019; down by 1 per cent in the period at constant FX.
The retention remained strong and consistent at 80 per cent by the Group. However, to some extent retention was down in Canada and the United Kingdom. The company saw significant improvements in UK Personal Lines and Scandinavia.
The companyâs Underlying profit before taxation was recorded at £624 million, excluding exit portfolios. The companyâs Statutory profit before taxation was up by 3 per cent to £492 million in FY19 as compared to £480 million in FY18. The Groupâs total business operating profit increased to £597 million in FY19 as against £517 million in FY18. The companyâs Investment Income was down by 5 per cent to £306 million in FY19 from £322 million in FY18. The companyâs Statutory profit after taxation increased to £383 million in FY19 as against £372 million in FY18. The companyâs Underlying EPS, excluding exit portfolios stood at 44.5 pence during 2019. The company has proposed a final dividend of 15.6 pence per ordinary share.
Business overview: Â RSA Insurance Group Plc
With a heritage of 300 years, RSA Insurance Group plc (LON:RSA) is a globally listed insurance company which offers services directly to consumers. The company operates in three core business divisions, namely, UK & International, Scandinavia and Canada. The company offer businesses in more than a hundred nations across the globe. The Group has a representative base of more than 12 thousand employees.
RSA Insurance Group Plc -Stock price performance
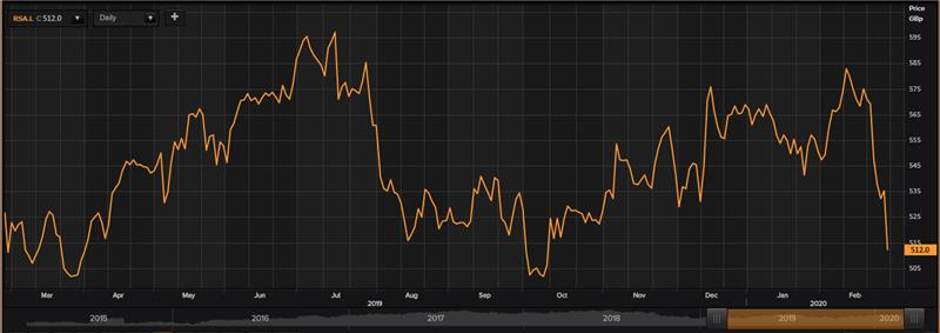
Daily Chart as at Feb-28-20, before the market close (Source: Thomson Reuters)
On 28th February 2020, at the time of writing (before market close, GMT 09:02 AM), RSA Insurance Group plcâs shares were trading at GBX 512.20, down by 4.26 per cent against its previous day closing price 535.00. Stock's 52 weeks High and Low is GBX 736.84 /GBX 497.20. At the time of writing, the share was trading 30.49% lower than its 52w High and 3.02% higher than its 52w low. The companyâs stock beta was 0.98, reflecting slightly lesser volatility as compared to the benchmark index. The outstanding market capitalisation was around £5.52 billion along with an annual dividend yield of 3.98%.
Howden Joinery Group Plc - Financial Results for 2019
(Source: Companyâs filings, London Stock Exchange)
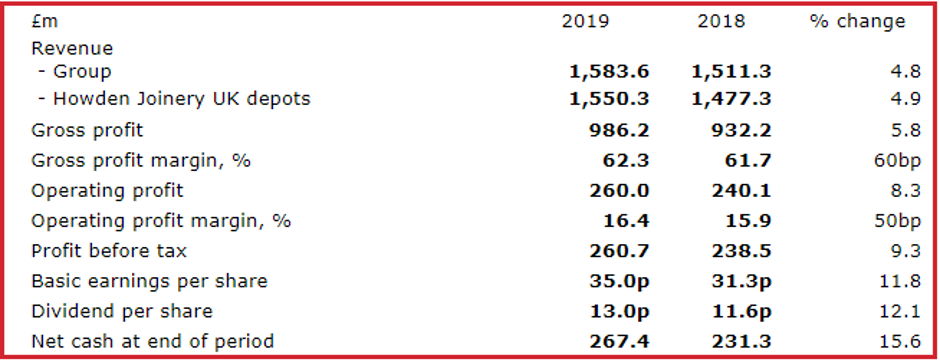
The Total Group revenue of the company increased by £72.3 million to £1,583.6 million during the period. Howden Joinery UK depot revenue surged by 4.9 per cent to £1,550.3 million in the fiscal year 2019 as against £1,477.3 million in the fiscal year 2018. The UK revenue surged by 2.5 per cent on the same depot basis to £1,507.1 million during the period as against £1,470.9 million in FY18.
Due to the closure of depots in the Netherlands and Germany in January 2019, Depot revenue in Continental Europe was down to £33.3 million in FY19 as against £34 million in FY18.
The Gross profit of the company increased to £986.2 million during the period as against £932.2 million in FY18. The Operating profit rose to £260 million during the period as against £240.1 million in the fiscal year 2018, resulting in an operating profit margin of 16.4 per cent (2018: 15.9%).
In the reported year, selling and distribution costs and administrative expenses increased to £726.2 million as compared to £692.1 million in 2018. The Net interest income during the period was £0.7 million. The companyâs Profit before taxation stood at £260.7 million in the fiscal year 2019 as against £238.5 million in the fiscal year 2018.
Due to an effective rate of tax of 19.8% (2018: 20.2%), the tax charge on profit before taxation was £51.7 million during the period as against £48.1 million in 2018. This resulted in Profit after taxation of £209 million in FY19 as against £190.4 million in FY18. The companyâs basic earnings per share stood at 35 pence in FY19 as against 31.3 pence in FY18.  The companyâs annual dividend surged by 12.1 per cent to 13 pence per share in FY19 as against 11.6 pence in FY18.
Business overview: Howden Joinery Group Plc
Howden Joinery Group Plc (LON:HWDN) is the UK based Industrial support services company that acts as the parent company of Howdens Joinery, which is one of the biggest provides of Kitchen and Joineries in the country. Howdens offers several kitchen ranges designed into âfamiliesâ for simple choice, it also offers kitchen cupboards and frontals. The Group supplies fitted kitchens, joinery, and appliances products. The companyâs operations are spread across various locations, namely the United Kingdom, France, and Belgium.
Howden Joinery Group Plc -Stock price performance
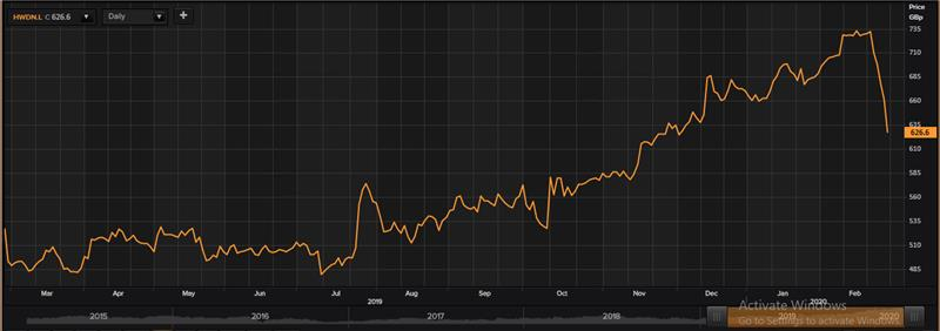
Daily Chart as at Feb-28-20, before the market close (Source: Thomson Reuters)
On 28th February 2020, at the time of writing (before market close, GMT 09:08 AM), Howden Joinery Group PLCâs shares were trading at GBX 625.80, down by 5.30 per cent against its previous day closing price. Stock's 52 weeks High and Low is GBX 736.80/GBX 477.46. At the time of writing, the share was trading 15.07% lower than its 52w High and 31.07% higher than its 52w low. The companyâs stock beta was 0.54, reflecting lesser volatility as compared to the benchmark index. The outstanding market capitalisation was around £3.96 billion along with an annual dividend yield of 1.74%.
Greencoat UK Wind Plc Financial Highlights 2019
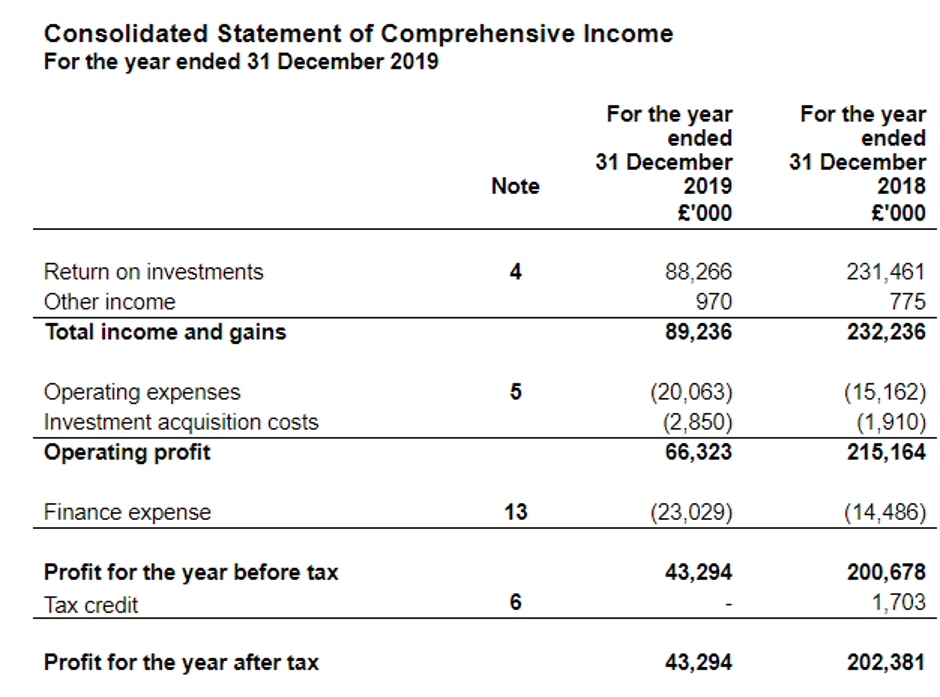
(Source: Companyâs filings, London Stock Exchange)
With £506 million of new equity raised and £598 million invested in new wind farms, 2019 was a significant year of growth for the Company. Owing to low wind resource, the portfolio generation was below budget at 2,385GWh along with Power prices during the year. Despite these adverse conditions, the company and wind farm SPVs managed to generate net cash of £127.7 million. The company paid £93.2 million in Dividends during the year with a healthy dividend cover of 1.4x. During the year, through displacing thermal power generation, the company managed to provide electricity to nearly 1 million homes and reduce carbon dioxide emissions at the rate of 1.2 million tonnes per annum approximately.
Business overview: Greencoat UK Wind Plc
Greencoat UK Wind Plc (LON:UKW), a renewable infrastructure fund has the main objective to invest in operations of the UK wind farms and preserve capital on a real-time basis. The company reinvests plentiful of cashflows in operating extra UK wind farms. The company also invests in income-producing wind farms, offshore as well as onshore.
Greencoat UK Wind Plc-Stock price performance
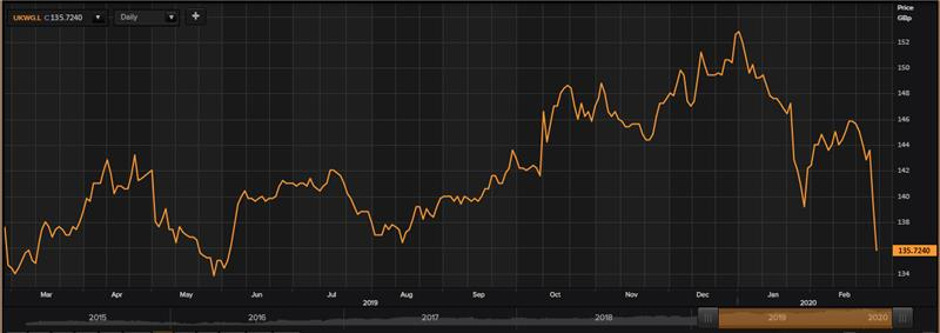
Daily Chart as at Feb-28-20, before the market close (Source: Thomson Reuters)
On 28th February 2020, at the time of writing (before market close, GMT 09:15 AM), Greencoat UK Wind Plcâs shares were trading at GBX 136, down by 2.44 per cent against its previous day closing price. Stock's 52 weeks High and Low is GBX 155.00 /GBX 133.00. At the time of writing, the share was trading 12.26% lower than its 52w High and 2.26% higher than its 52w low. The companyâs stock beta was 0.34, reflecting lesser volatility as compared to the benchmark index. The outstanding market capitalisation was around £2.18 billion along with an annual dividend yield of 4.83%.
