


In the past three years, the broader indices of the London Stock Exchange the FTSE 100 and FTSE 250 have witnessed steep volatilities or ups and downs, which was substantially fuelled by Brexit and later the US-China trade dispute has also fuelled volatility in the global equity markets and in the UK market as well. The Brexit-related uncertainties have not led UK stocks to catch up the bull trend in global stocks over the same period. As broader indices of Wall Street have registered all-time highs, the UK indices are still struggling to register a breakout above their 52-week highs.
However, post-December 2019 general elections, in which Boris Johnson-led Conservatives bagged stonking majority, the Brexit fog has cooled down to some extent. This has helped UK indices to move up ever since the election results were out.
Especially, the mid-cap index has risen the most against the broader index- FTSE 100, which is more of a gauge of global stocks.
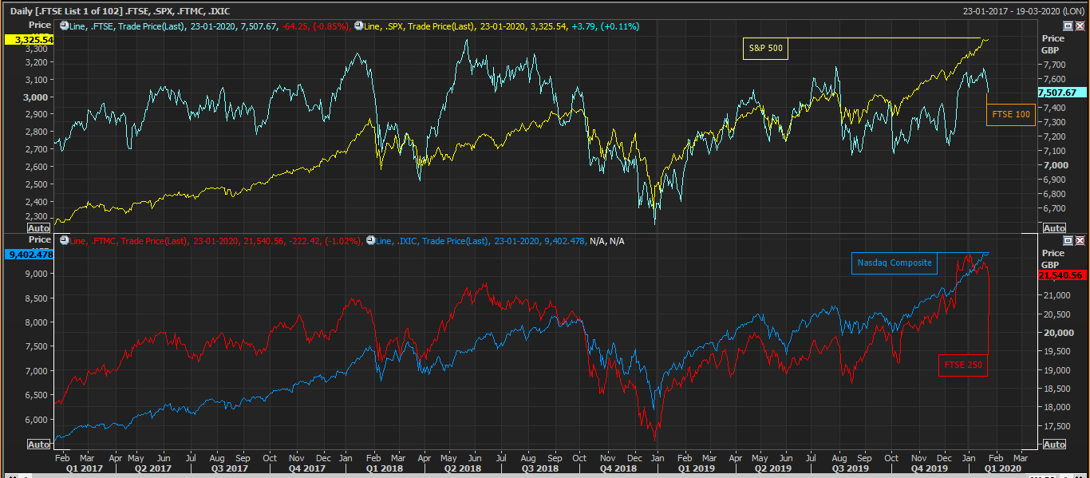
3-yrs daily price chart of FTSE 100, FTSE 250, S&P 500 and Nasdaq Composite Index (as on January 24, 2020, before the market close). Source: Thomson Reuters.
However, there were many individual counters, which, despite a down cycle in the UK market, have provided investors a fortune in the past three years.
These companies have been through down cycles and have still reported consistency in returns.
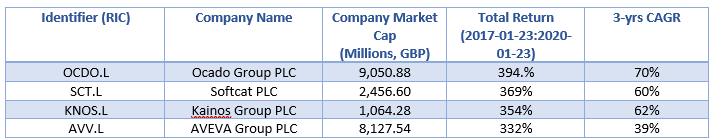
Source: Thomson Reuters, Kalkine Analysis
Ocado Group PLC: Based on strong fundamentals, shares of LON: OCDO have multiplied its shareholder's fortune in the past three years. Its shares have surged from GBX 261.4 (as on January 23, 2020) to GBX 1,292 (as on January 23, 2020), which implies a compounded average growth rate (CAGR) return of 70% or and the total return of 394% in the same period.
If £10,000 was invested in Ocado Plc three years before, that would worth approximately £39,426.17 today, whereas the FTSE 100 index delivered a CAGR return of less than 1.6% and the total return of just 5% during the same time, which reflects that shares of OCDO considerably outperformed the broader in the past three years. This shows a relative price outperformance of 389.3% in absolute terms and 69% in CAGR terms against the broader benchmark index of the London bourse.
Ocado Group Plc is the UK-based largest online grocery retailer with a market capitalisation of £9.17bn, lifted approximately GBX 368 or 40% in the year-over period. The group's operations lie in grocery retailing and the development and monetisation of intellectual property (IP) and technology used in online retailing, logistics and distribution of grocery and consumer goods.
The LTM Price-to-Sales multiple of the company stood at 5.36x, which is approximately 2.7 times of the industry average of 1.95, respectively (according to the Thomson Reuters data).
Softcat PLC: Shares of LON: SCT turned out to be a Multibagger in the past three years and handed a humungous return to its shareholders. As from GBX 300.1 as of January 23, 2017, it flared up to GBX 1,236 as on January 23, 2020, which implies a compounded average growth rate (CAGR) return of 60% or and a total return of 368% in the same period.
If £10,000 invested in Softcat PLC three years before, that would worth approximately £ 36,853.4 today, whereas its benchmark FTSE 250 index delivered a CAGR return of less than 6.3% and a total return of just 20% during the same time. Which reflects that shares of SCT considerably outperformed its benchmark index over the same time period. This shows a relative price outperformance of 348.5% in absolute terms and 54% in CAGR terms against the broader mid-cap benchmark index of the London bourse.
The £2.45bn market-cap Softcat PLC is a United Kingdom-based an information technology (IT) reseller and IT infrastructure solutions provider to the corporate and public sector markets. Its shares gained approximately 85% on a year-ago period, whereas FTSE 250 advanced approximately 15% in the same time. This shows that SCTâs stock has outperformed its benchmark index by 5.6 times.
The LTM Price-to-Earnings multiple of the company stood at 36.25x, which is approximately 1.3 times of the industry average of 28.056, respectively (according to the Thomson Reuters data).
Kainos Group PLC: London Stock Exchange-traded stocks of LON: KNOS delivered a massive return to its shareholders over the past three years. As its shares have leapt up from GBX 204.0 as on January 23, 2017, to GBX 871.98 as on January 23, 2020, which reflects a compounded average growth rate (CAGR) return of 62% or and a total return of 353.7% in the past three years.
If £10,000 invested in Kainos Group PLC three years before, that would worth approximately £ 35,369.43 today. Which reflects that shares of KNOS considerably outperformed its benchmark index in over the same time period. This shows a relative price outperformance of 333.7% in absolute terms and 56% in CAGR terms against the broader mid-cap benchmark index of the London bourse.
Kainos Group PLC is a United Kingdom-based a digital service provider and offers information technology products and services to clients in a range of industries including healthcare, financial services and government as well. The £1.06bn market capitalisation company has lifted approximately 113.73% in a year-over period, reflects a relative outperformance of approximately 98% against the benchmark FTSE 250, which increased about 15% in the same period.
The LTM Price/Earnings multiple of the stock stood at 54.32, which is approximately 1.9 times of the industry average of 28.06, respectively (according to the Thomson Reuters data).
AVEVA Group PLC: Â Built on strong fundamental, stocks of LON: AVV have handed gargantuan amount of wealth for its shareholders. As the stocks have surged from GBX 1,867.0 as on January 23, 2017, to GBX 5,025 as on January 23, 2020, which implies a compounded average growth rate (CAGR) return of 39% or and a total return of 332.3% in the past three years.
If £10,000 invested in AVEVA Group PLC three years before, that would worth approximately £33,231.6 today. Which reflects that shares of AVV considerably outperformed its benchmark index the FTSE 100 over the same time period. This shows a relative price outperformance of 327.3% in absolute terms and 37% in CAGR terms.
The £8.11bn market-cap is the UK's largest software and computer services company in terms of the market capitalisation. The group is a holding company that provides engineering, design and information management software services. Its geographical segment divided into three broader segments: the Asia Pacific, Americas, and Europe, Middle East and Africa (EMEA), respectively. As on December 05, 1996, its shares got admitted to the main market of the London Stock Exchange and the group is the constituent stock of the FTSE 100 index.
On a YoY basis, shares of AVV delivered a massive return of 85%, and its relative outperformance against the benchmark the FTSE 100 index stood at 68.77%, and relative performance against the sector stood at 46.5%, respectively.
Also, from the valuation standpoint, AVV shares were trading at a Price-to-Earnings (PE) multiple of 145.48x, which is approximately 5.2 times of the industry average of 28.06, respectively (according to the Thomson Reuters data).
