
_07_03_2026_03_50_21_133108.jpg)


Capita PLC
Capita PLC (CPI) is a London, the United Kingdom-based company, which delivers and creates support services to clients in the public and private sectors. The companyâs business is differentiated in nine segments: Integrated Services, Property & Health, IT Enterprise Services, Insurance & Benefits Services, Local Government, Capita Europe, Digital & Software Solutions, Customer Management, and Workplace Services. The group operates in Northern Europe, India, Dubai, the United States, the United Kingdom, South Africa, and Ireland.
Recent developments
The company got its PIP (Personal Independence Payment) assessment contract extended by two years, with respect to the Department for Work and Pensions (DWP), valued at £112 million.
The company was awarded contracts (fire and rescue services) by the defence ministry. The contract was valued at £525 million with a maturity of over 12 years.
Financial highlights for H1 FY19
The companyâs revenue stood at £1,852.0m in H1 FY19 as against £2,012.6m in H1 FY18. The companyâs Reported Operating profit stood at £60.8m in H1 FY19 as against £66.7m in H1 FY18. The companyâs Reported Profit before tax stood at £31.2m in H1 FY19 as against £42.3m in H1 FY18. The companyâs earnings per share stood at 1.36 pence in H1 FY19 as against 4.86 pence in H1 FY18.
The company has delivered a successful performance in the current financial year and is making a significant transformation. In 2019, the company expects adjusted profit before tax (PBT) to be in the range of £265-£295 million and adjusted net finance costs of £40 million. Net debt to EBITDA ratio is expected to be in the range of 1.0x- 2.0x.
In FY2020, initial cost savings target is of £175 million, sustainable annual free cash flow (before exceptional and restructuring charges) is likely to be at least £200 million and a double-digit adjusted EBIT margin too is estimated for the period.
In the future, environmental regulations, foreign exchange risks and expansion by competitors could affect its business operations, but the group is well placed to maximise opportunities and manage the challenges through improved programme execution and maintain the strategy and capital allocation policy.
Capita PLC Share price performance
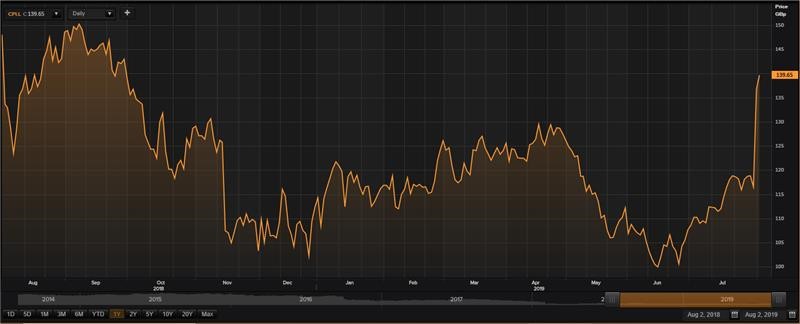
Daily Chart as at 02-August-19, before the market close (Source: Thomson Reuters)
At the time of writing (as on 2nd August 2019, at 03:00 PM GMT), shares of Capita PLC were quoting at GBX 139.65 per share; up by 2.12 per cent against the previous day's closing price level. The companyâs market capitalisation (outstanding) stood at around £2.29 billion.
In the previous 52-week, Capita PLC shares have recorded a peak of GBX 152.15 (as 06 September 2018) and a 52-week low of GBX 98.66 (as on 17 June 2019). At the current trading level, as quoted in the price chart, its shares were trading 8.21 per cent below the 52-week high price level and 41.54 per cent above the 52-week low price level.
The stockâs volume (before the market close, at the time of writing) stood at 6,194,419. Stock's average traded volume for 5 days was 4,679,774; 30 days- 4,366,707.50 and 90 days â 3,834,984.72.
The average traded volume for 5 days surged by 7.17 per cent as against 30 days average traded volume. The companyâs stock beta stood at 1.40, which means it was 40 per cent more volatile as compared to the benchmark index.
The shares of the group (while writing) were trading higher than the 60-days and 200-days Simple Moving Averages (SMA), which exhibits an uptrend in the stock price level.
In the past 1 year, shares of Capita PLC have delivered a negative price return of 7.63 per cent. However, on a year-to-date basis, the stock was up by approximately 21.83 per cent and gained 8.36 per cent in the past three months.
Share's RSI for the 30-days, 14-days and 9-days stood at 69.58, 81.12 and 85.48 respectively. Also, the stockâs 3-days RSI was recorded at 92.02. The volatility of the stock for 30 Days, 90 Days, 200 Days was recorded at 51.05, 37.02 and 42.65 respectively.
 Staffline Group PLC
Staffline Group plc (STAF) provides human capital by facilitating recruitment services to industry and services with respect to skill-enhancing trainings, to be job-ready.
Financial highlights for FY18
The companyâs Statutory revenue surged by 17.7 per cent to £1,127.5 million in FY18 as against £957.8 million in FY17. The companyâs underlying profit before tax (PBT) declined by 0.8 per cent to £36.0 million in FY18 as against £36.3 million in FY17. The companyâs underlying diluted earnings per share (EPS) plunged by 2.2 per cent to 110.1 pence per share in FY18 as against 112.6 pence per share in FY17. The company cancelled its final dividend this year, it was 15.7 pence per share in FY17. The companyâs Statutory net debt surged to £63 million in FY18 as against £16.5 million in FY17.
Staffline Group Plc Share price performance
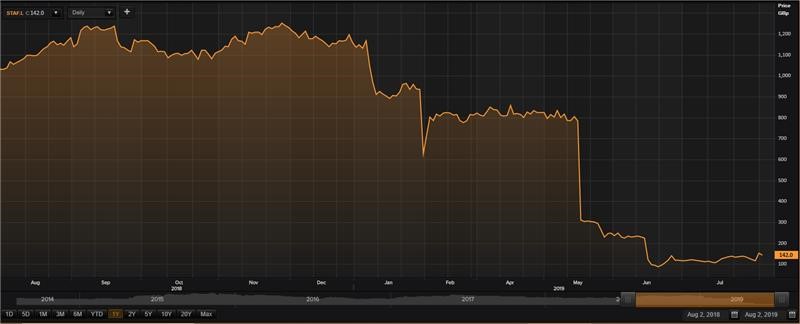
Daily Chart as at 02-August-19, before the market close (Source: Thomson Reuters)
At the time of writing (as on 2nd August 2019, at 03:07 PM GMT), shares of Staffline Group plc were quoting at GBX 142 per share; down by 5.45 per cent against the previous day's closing price level. The companyâs market capitalisation (outstanding) stood at £103.76 million.
In the last 52-week, shares of Staffline have registered a high of GBX 1,269.33 (as on 30 Nov 2018) and a low of GBX 84.19 (as on 20 June 2019). At the current trading level, as quoted in the price chart, its shares were trading 88.81 per cent below the 52-week high price level and 68.66 per cent above the 52-week low price level.
The stockâs volume (before the market close, at the time of writing) stood at 794,167. Stock's average traded volume for 5 days was 2,398,573.60; 30 days- 1,166,778.46 and 90 days â 570,332.55.
The average traded volume for 5 days surged by 105.57 per cent as against 30 days average traded volume. The companyâs stock beta was 0.66, which means it was less volatile than the benchmark index.
The shares of the group (while writing) were trading lower than the 60-days and 200-days Simple Moving Average (SMA), which exhibits a potential downside in the stock price level.
In the past 1 year, shares of Staffline have delivered a negative price return of 85.40 per cent. Also, on a year-to-date basis, the stock was down by approximately 87.02 per cent and has plunged by 81.77 per cent in the past three months.
Share's RSI for the 30-days, 14-days and 9-days stood at 35.48, 52.86 and 65.03 respectively. Also, the stockâs 3-days RSI was recorded at 79.83. The volatility of the stock for 200 Days, 90 Days, 30 Days stood at 151.53, 208.54 and 127.66 respectively.
 Trainline PLC
Trainline plc is a UK based company which provides travel-related services, such as online ticketing, planning a trip, and other related services. The tickets can be bought on behalf of the train operators through mobile applications, website and point of contact.
Trading statement for Q1 FY20
The company reported a strong growth in net ticket revenue of 27 per cent year-on-year in the first quarter of the financial year 2020, well supported by online ticketing and mobile application platforms. In addition, the net ticket revenue (international) was up by 51 per cent year-on-year.
Trainline plc Share price performance
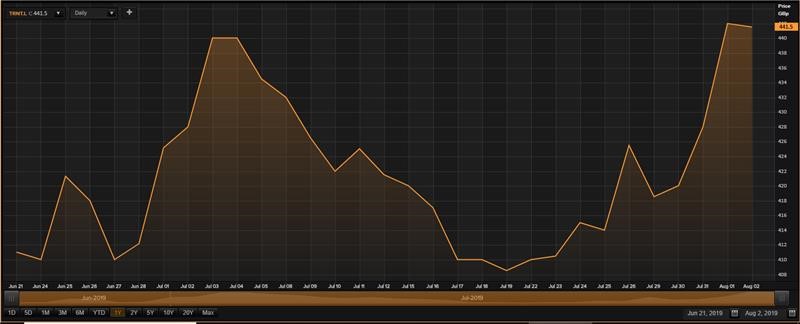
Daily Chart as at 02-August-19, before the market close (Source: Thomson Reuters)
At the time of writing (as on 2nd August 2019, at 03:10 PM GMT), shares of Trainline plc were quoting at GBX 441.5 per share; down by 0.11 per cent against the previous day's closing price level. The companyâs market capitalisation (outstanding) stood at £2.13 billion.
In the last 52-week, shares of Trainline have registered a high of GBX 451.00 (as on 04 Jul 2019) and a low of GBX 350.00 (as on 21 June 2019). At the current trading level, as quoted in the price chart, its shares were trading 2.10 per cent below the 52-week high price level and 26.14 per cent above the 52-week low price level.
The stockâs volume (before the market close, at the time of writing) stood at 89,684. Stock's average traded volume for 5 days was 557,522.60; 30 days- 3,346,932.57. The average traded volume for 5 days plunged by 83.34 per cent as against 30 days average traded volume.
The shares of the group (while writing) were trading higher than the 30-day Simple Moving Average (SMA), which shows an uptrend in the stock price level.
On a year-to-date basis, the stock was up by approximately 7.54 per cent and plunged by 81.77 per cent in the past three months. Share's RSI for the 14-days, 9-days and 3-days stood at 68.27, 73.79 and 90.52 respectively.
